Immigrants from Latvia vs Puerto Rican Single Male Poverty
COMPARE
Immigrants from Latvia
Puerto Rican
Single Male Poverty
Single Male Poverty Comparison
Immigrants from Latvia
Puerto Ricans
12.2%
SINGLE MALE POVERTY
97.0/ 100
METRIC RATING
101st/ 347
METRIC RANK
25.1%
SINGLE MALE POVERTY
0.0/ 100
METRIC RATING
343rd/ 347
METRIC RANK
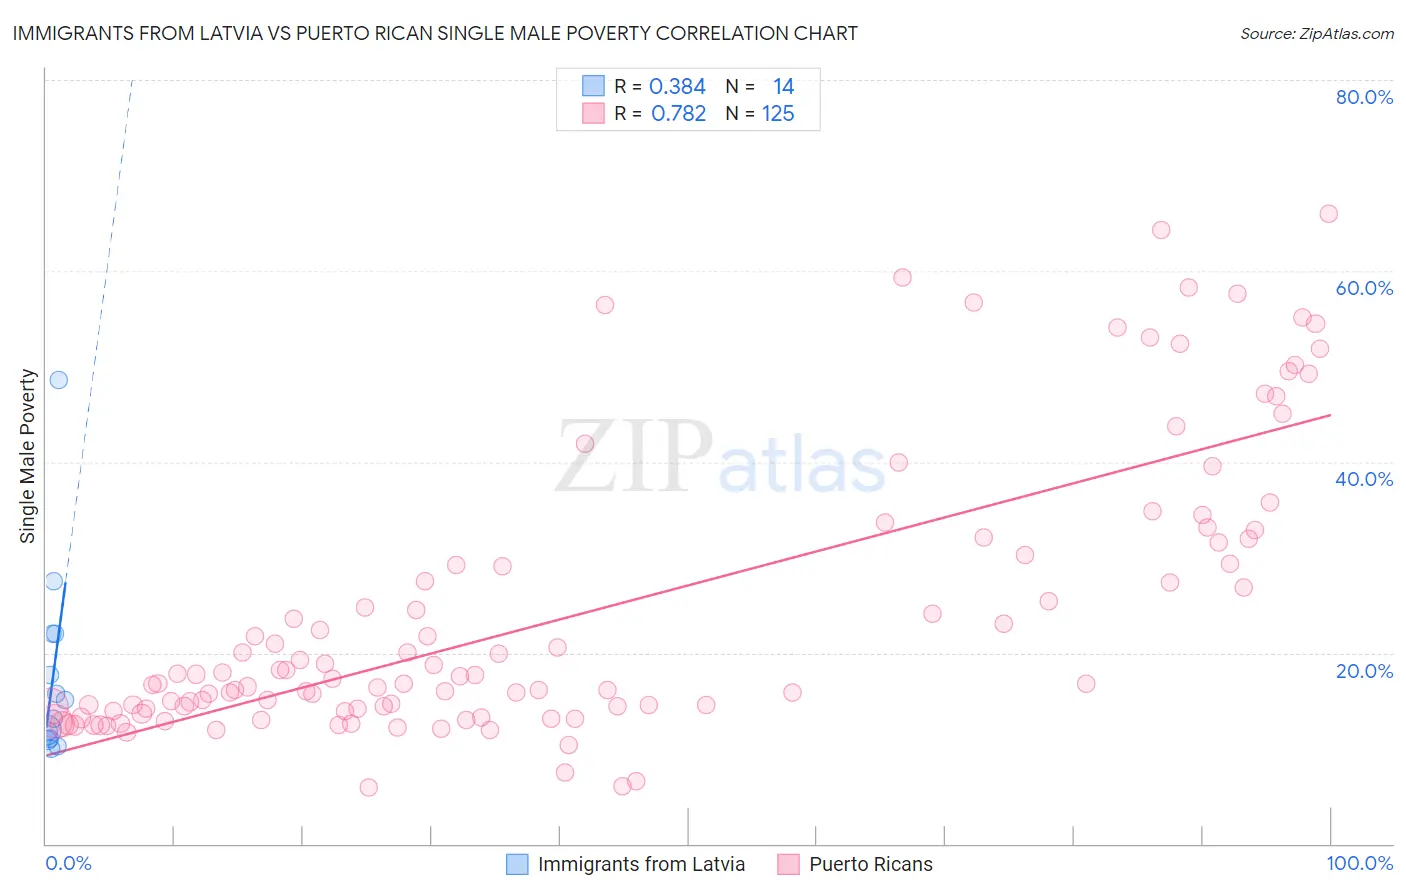
Immigrants from Latvia vs Puerto Rican Single Male Poverty Correlation Chart
The statistical analysis conducted on geographies consisting of 106,119,330 people shows a mild positive correlation between the proportion of Immigrants from Latvia and poverty level among single males in the United States with a correlation coefficient (R) of 0.384 and weighted average of 12.2%. Similarly, the statistical analysis conducted on geographies consisting of 451,233,514 people shows a strong positive correlation between the proportion of Puerto Ricans and poverty level among single males in the United States with a correlation coefficient (R) of 0.782 and weighted average of 25.1%, a difference of 105.4%.
Single Male Poverty Correlation Summary
| Measurement | Immigrants from Latvia | Puerto Rican |
| Minimum | 9.9% | 5.9% |
| Maximum | 48.6% | 66.0% |
| Range | 38.7% | 60.0% |
| Mean | 17.7% | 24.3% |
| Median | 14.1% | 17.6% |
| Interquartile 25% (IQ1) | 11.0% | 14.2% |
| Interquartile 75% (IQ3) | 22.0% | 31.7% |
| Interquartile Range (IQR) | 11.0% | 17.6% |
| Standard Deviation (Sample) | 10.4% | 14.8% |
| Standard Deviation (Population) | 10.0% | 14.8% |
Similar Demographics by Single Male Poverty
Demographics Similar to Immigrants from Latvia by Single Male Poverty
In terms of single male poverty, the demographic groups most similar to Immigrants from Latvia are Immigrants from Europe (12.2%, a difference of 0.010%), Immigrants from Australia (12.2%, a difference of 0.030%), Immigrants from Cuba (12.2%, a difference of 0.15%), Immigrants from Armenia (12.2%, a difference of 0.15%), and Immigrants from Kazakhstan (12.2%, a difference of 0.15%).
| Demographics | Rating | Rank | Single Male Poverty |
| Colombians | 97.8 /100 | #94 | Exceptional 12.2% |
| Mongolians | 97.7 /100 | #95 | Exceptional 12.2% |
| Immigrants | Sweden | 97.5 /100 | #96 | Exceptional 12.2% |
| Immigrants | Italy | 97.4 /100 | #97 | Exceptional 12.2% |
| Guamanians/Chamorros | 97.4 /100 | #98 | Exceptional 12.2% |
| Immigrants | Cuba | 97.3 /100 | #99 | Exceptional 12.2% |
| Immigrants | Australia | 97.1 /100 | #100 | Exceptional 12.2% |
| Immigrants | Latvia | 97.0 /100 | #101 | Exceptional 12.2% |
| Immigrants | Europe | 97.0 /100 | #102 | Exceptional 12.2% |
| Immigrants | Armenia | 96.7 /100 | #103 | Exceptional 12.2% |
| Immigrants | Kazakhstan | 96.7 /100 | #104 | Exceptional 12.2% |
| Jordanians | 95.9 /100 | #105 | Exceptional 12.3% |
| Immigrants | Morocco | 95.6 /100 | #106 | Exceptional 12.3% |
| Iraqis | 95.1 /100 | #107 | Exceptional 12.3% |
| Immigrants | Eastern Africa | 95.0 /100 | #108 | Exceptional 12.3% |
Demographics Similar to Puerto Ricans by Single Male Poverty
In terms of single male poverty, the demographic groups most similar to Puerto Ricans are Lumbee (25.2%, a difference of 0.31%), Navajo (25.3%, a difference of 1.1%), Houma (23.5%, a difference of 6.9%), Crow (23.3%, a difference of 7.8%), and Hopi (27.5%, a difference of 9.7%).
| Demographics | Rating | Rank | Single Male Poverty |
| Inupiat | 0.0 /100 | #333 | Tragic 20.0% |
| Pima | 0.0 /100 | #334 | Tragic 20.2% |
| Yuman | 0.0 /100 | #335 | Tragic 21.3% |
| Tohono O'odham | 0.0 /100 | #336 | Tragic 21.6% |
| Apache | 0.0 /100 | #337 | Tragic 21.6% |
| Pueblo | 0.0 /100 | #338 | Tragic 21.6% |
| Arapaho | 0.0 /100 | #339 | Tragic 21.9% |
| Sioux | 0.0 /100 | #340 | Tragic 22.2% |
| Crow | 0.0 /100 | #341 | Tragic 23.3% |
| Houma | 0.0 /100 | #342 | Tragic 23.5% |
| Puerto Ricans | 0.0 /100 | #343 | Tragic 25.1% |
| Lumbee | 0.0 /100 | #344 | Tragic 25.2% |
| Navajo | 0.0 /100 | #345 | Tragic 25.3% |
| Hopi | 0.0 /100 | #346 | Tragic 27.5% |
| Yup'ik | 0.0 /100 | #347 | Tragic 31.6% |