Ute vs Hmong Single Male Poverty
COMPARE
Ute
Hmong
Single Male Poverty
Single Male Poverty Comparison
Ute
Hmong
15.7%
SINGLE MALE POVERTY
0.0/ 100
METRIC RATING
307th/ 347
METRIC RANK
14.2%
SINGLE MALE POVERTY
0.0/ 100
METRIC RATING
280th/ 347
METRIC RANK
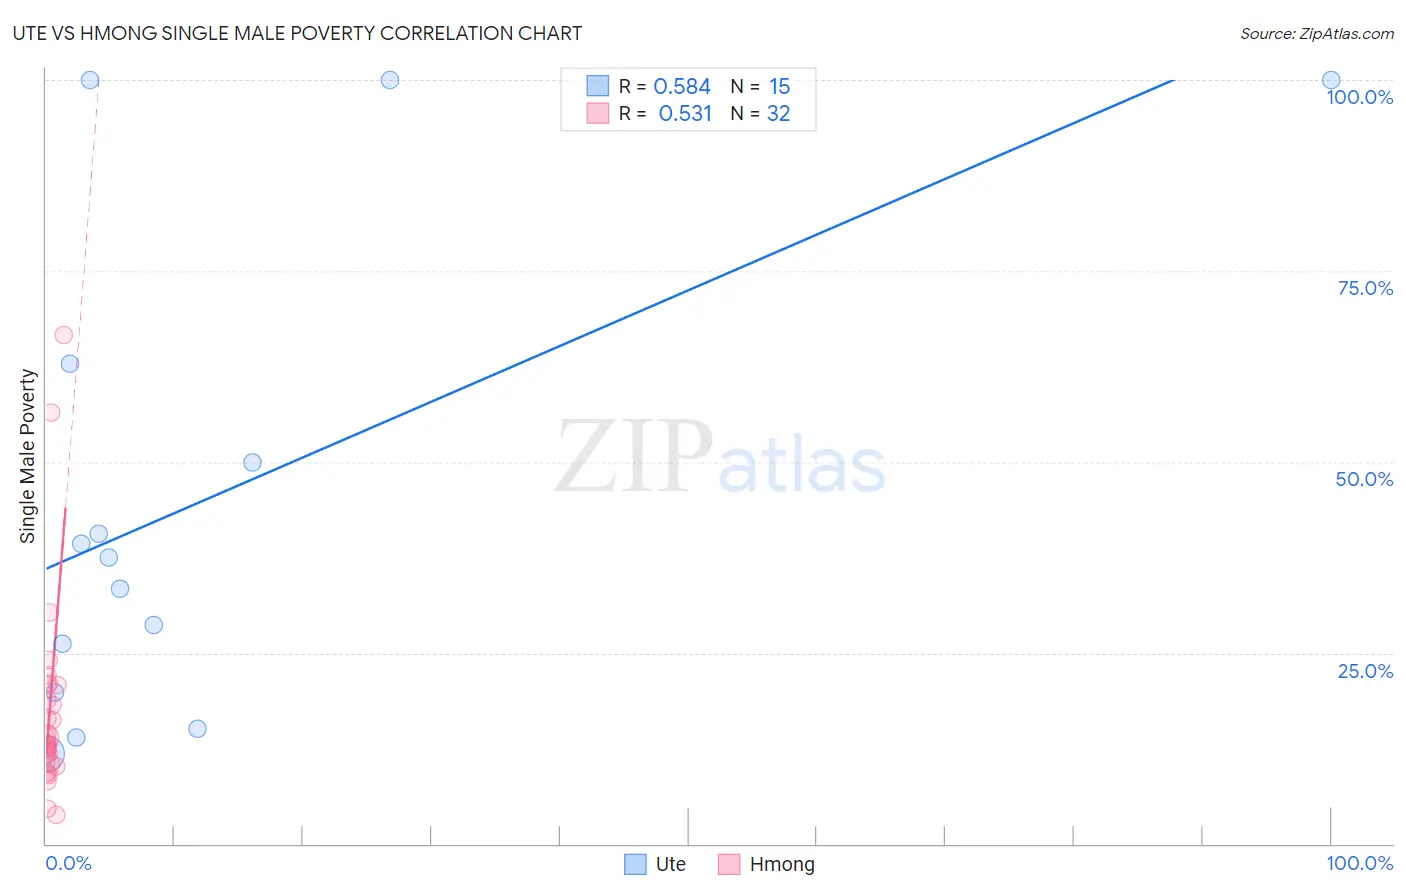
Ute vs Hmong Single Male Poverty Correlation Chart
The statistical analysis conducted on geographies consisting of 54,243,903 people shows a substantial positive correlation between the proportion of Ute and poverty level among single males in the United States with a correlation coefficient (R) of 0.584 and weighted average of 15.7%. Similarly, the statistical analysis conducted on geographies consisting of 24,410,058 people shows a substantial positive correlation between the proportion of Hmong and poverty level among single males in the United States with a correlation coefficient (R) of 0.531 and weighted average of 14.2%, a difference of 10.5%.
Single Male Poverty Correlation Summary
| Measurement | Ute | Hmong |
| Minimum | 11.8% | 3.8% |
| Maximum | 100.0% | 66.7% |
| Range | 88.2% | 62.9% |
| Mean | 45.2% | 17.1% |
| Median | 37.4% | 13.0% |
| Interquartile 25% (IQ1) | 19.9% | 10.6% |
| Interquartile 75% (IQ3) | 62.8% | 19.8% |
| Interquartile Range (IQR) | 42.9% | 9.2% |
| Standard Deviation (Sample) | 31.5% | 13.0% |
| Standard Deviation (Population) | 30.4% | 12.8% |
Similar Demographics by Single Male Poverty
Demographics Similar to Ute by Single Male Poverty
In terms of single male poverty, the demographic groups most similar to Ute are Potawatomi (15.8%, a difference of 0.57%), American (15.8%, a difference of 0.73%), Pennsylvania German (15.6%, a difference of 0.75%), Blackfeet (15.5%, a difference of 1.2%), and Yakama (15.9%, a difference of 1.6%).
| Demographics | Rating | Rank | Single Male Poverty |
| Cree | 0.0 /100 | #300 | Tragic 15.1% |
| Dominicans | 0.0 /100 | #301 | Tragic 15.2% |
| Alsatians | 0.0 /100 | #302 | Tragic 15.2% |
| Aleuts | 0.0 /100 | #303 | Tragic 15.4% |
| Alaska Natives | 0.0 /100 | #304 | Tragic 15.4% |
| Blackfeet | 0.0 /100 | #305 | Tragic 15.5% |
| Pennsylvania Germans | 0.0 /100 | #306 | Tragic 15.6% |
| Ute | 0.0 /100 | #307 | Tragic 15.7% |
| Potawatomi | 0.0 /100 | #308 | Tragic 15.8% |
| Americans | 0.0 /100 | #309 | Tragic 15.8% |
| Yakama | 0.0 /100 | #310 | Tragic 15.9% |
| Seminole | 0.0 /100 | #311 | Tragic 16.0% |
| Comanche | 0.0 /100 | #312 | Tragic 16.0% |
| Cherokee | 0.0 /100 | #313 | Tragic 16.1% |
| Alaskan Athabascans | 0.0 /100 | #314 | Tragic 16.1% |
Demographics Similar to Hmong by Single Male Poverty
In terms of single male poverty, the demographic groups most similar to Hmong are Hispanic or Latino (14.2%, a difference of 0.030%), Spanish American (14.2%, a difference of 0.18%), Yaqui (14.2%, a difference of 0.34%), Indonesian (14.1%, a difference of 0.70%), and Slovak (14.1%, a difference of 0.74%).
| Demographics | Rating | Rank | Single Male Poverty |
| Welsh | 0.1 /100 | #273 | Tragic 14.0% |
| Hondurans | 0.1 /100 | #274 | Tragic 14.0% |
| English | 0.1 /100 | #275 | Tragic 14.1% |
| Dutch | 0.1 /100 | #276 | Tragic 14.1% |
| Immigrants | Honduras | 0.0 /100 | #277 | Tragic 14.1% |
| Slovaks | 0.0 /100 | #278 | Tragic 14.1% |
| Indonesians | 0.0 /100 | #279 | Tragic 14.1% |
| Hmong | 0.0 /100 | #280 | Tragic 14.2% |
| Hispanics or Latinos | 0.0 /100 | #281 | Tragic 14.2% |
| Spanish Americans | 0.0 /100 | #282 | Tragic 14.2% |
| Yaqui | 0.0 /100 | #283 | Tragic 14.2% |
| Immigrants | Bahamas | 0.0 /100 | #284 | Tragic 14.4% |
| French | 0.0 /100 | #285 | Tragic 14.4% |
| Celtics | 0.0 /100 | #286 | Tragic 14.5% |
| Iroquois | 0.0 /100 | #287 | Tragic 14.5% |