Ute vs Slavic Single Male Poverty
COMPARE
Ute
Slavic
Single Male Poverty
Single Male Poverty Comparison
Ute
Slavs
15.7%
SINGLE MALE POVERTY
0.0/ 100
METRIC RATING
307th/ 347
METRIC RANK
13.3%
SINGLE MALE POVERTY
5.3/ 100
METRIC RATING
231st/ 347
METRIC RANK
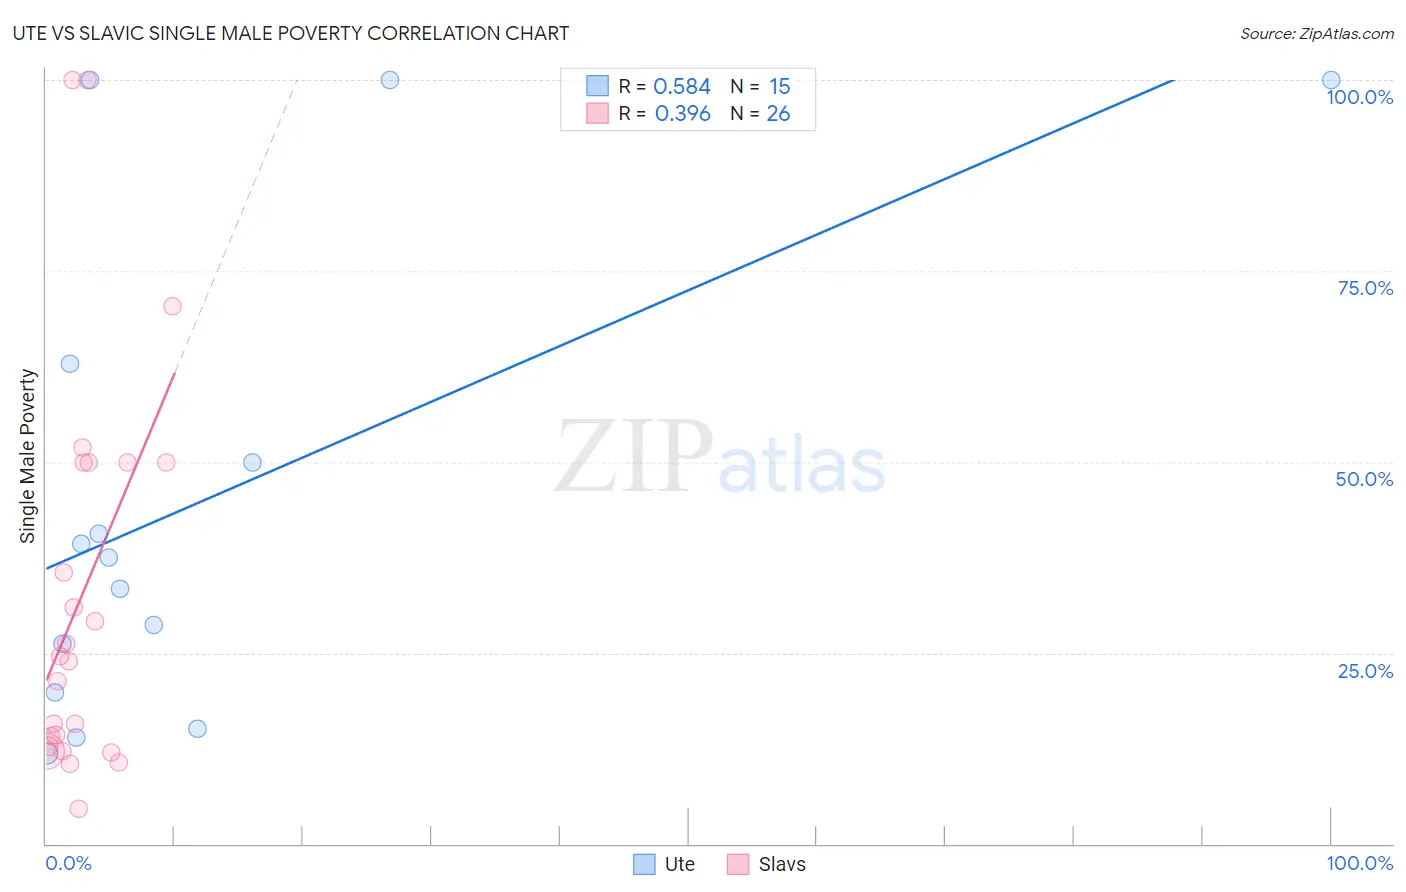
Ute vs Slavic Single Male Poverty Correlation Chart
The statistical analysis conducted on geographies consisting of 54,243,903 people shows a substantial positive correlation between the proportion of Ute and poverty level among single males in the United States with a correlation coefficient (R) of 0.584 and weighted average of 15.7%. Similarly, the statistical analysis conducted on geographies consisting of 243,137,231 people shows a mild positive correlation between the proportion of Slavs and poverty level among single males in the United States with a correlation coefficient (R) of 0.396 and weighted average of 13.3%, a difference of 18.0%.
Single Male Poverty Correlation Summary
| Measurement | Ute | Slavic |
| Minimum | 11.8% | 4.5% |
| Maximum | 100.0% | 100.0% |
| Range | 88.2% | 95.5% |
| Mean | 45.2% | 32.6% |
| Median | 37.4% | 24.2% |
| Interquartile 25% (IQ1) | 19.9% | 12.8% |
| Interquartile 75% (IQ3) | 62.8% | 50.0% |
| Interquartile Range (IQR) | 42.9% | 37.2% |
| Standard Deviation (Sample) | 31.5% | 26.2% |
| Standard Deviation (Population) | 30.4% | 25.6% |
Similar Demographics by Single Male Poverty
Demographics Similar to Ute by Single Male Poverty
In terms of single male poverty, the demographic groups most similar to Ute are Potawatomi (15.8%, a difference of 0.57%), American (15.8%, a difference of 0.73%), Pennsylvania German (15.6%, a difference of 0.75%), Blackfeet (15.5%, a difference of 1.2%), and Yakama (15.9%, a difference of 1.6%).
| Demographics | Rating | Rank | Single Male Poverty |
| Cree | 0.0 /100 | #300 | Tragic 15.1% |
| Dominicans | 0.0 /100 | #301 | Tragic 15.2% |
| Alsatians | 0.0 /100 | #302 | Tragic 15.2% |
| Aleuts | 0.0 /100 | #303 | Tragic 15.4% |
| Alaska Natives | 0.0 /100 | #304 | Tragic 15.4% |
| Blackfeet | 0.0 /100 | #305 | Tragic 15.5% |
| Pennsylvania Germans | 0.0 /100 | #306 | Tragic 15.6% |
| Ute | 0.0 /100 | #307 | Tragic 15.7% |
| Potawatomi | 0.0 /100 | #308 | Tragic 15.8% |
| Americans | 0.0 /100 | #309 | Tragic 15.8% |
| Yakama | 0.0 /100 | #310 | Tragic 15.9% |
| Seminole | 0.0 /100 | #311 | Tragic 16.0% |
| Comanche | 0.0 /100 | #312 | Tragic 16.0% |
| Cherokee | 0.0 /100 | #313 | Tragic 16.1% |
| Alaskan Athabascans | 0.0 /100 | #314 | Tragic 16.1% |
Demographics Similar to Slavs by Single Male Poverty
In terms of single male poverty, the demographic groups most similar to Slavs are Immigrants from Caribbean (13.3%, a difference of 0.090%), Ghanaian (13.3%, a difference of 0.18%), European (13.3%, a difference of 0.20%), Lebanese (13.2%, a difference of 0.30%), and Haitian (13.2%, a difference of 0.38%).
| Demographics | Rating | Rank | Single Male Poverty |
| Somalis | 9.1 /100 | #224 | Tragic 13.2% |
| Immigrants | Denmark | 8.7 /100 | #225 | Tragic 13.2% |
| Jamaicans | 7.7 /100 | #226 | Tragic 13.2% |
| Haitians | 7.0 /100 | #227 | Tragic 13.2% |
| Lebanese | 6.6 /100 | #228 | Tragic 13.2% |
| Europeans | 6.2 /100 | #229 | Tragic 13.3% |
| Ghanaians | 6.1 /100 | #230 | Tragic 13.3% |
| Slavs | 5.3 /100 | #231 | Tragic 13.3% |
| Immigrants | Caribbean | 5.0 /100 | #232 | Tragic 13.3% |
| British | 4.0 /100 | #233 | Tragic 13.3% |
| Canadians | 4.0 /100 | #234 | Tragic 13.3% |
| Bangladeshis | 3.7 /100 | #235 | Tragic 13.3% |
| Luxembourgers | 3.6 /100 | #236 | Tragic 13.4% |
| British West Indians | 3.4 /100 | #237 | Tragic 13.4% |
| Immigrants | Ghana | 3.2 /100 | #238 | Tragic 13.4% |