Carpatho Rusyn vs Puerto Rican Single Male Poverty
COMPARE
Carpatho Rusyn
Puerto Rican
Single Male Poverty
Single Male Poverty Comparison
Carpatho Rusyns
Puerto Ricans
13.4%
SINGLE MALE POVERTY
2.1/ 100
METRIC RATING
242nd/ 347
METRIC RANK
25.1%
SINGLE MALE POVERTY
0.0/ 100
METRIC RATING
343rd/ 347
METRIC RANK
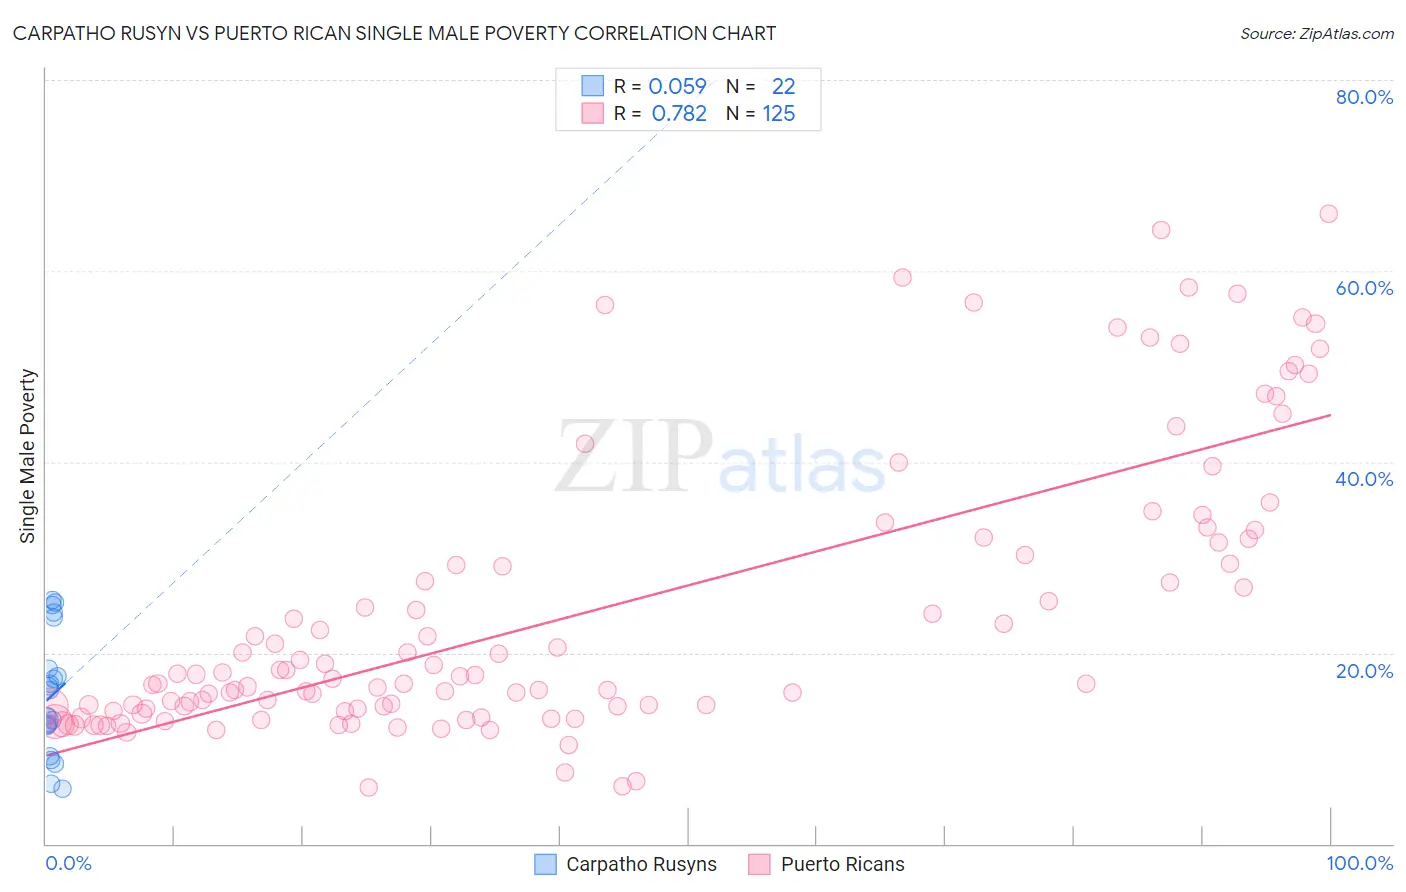
Carpatho Rusyn vs Puerto Rican Single Male Poverty Correlation Chart
The statistical analysis conducted on geographies consisting of 56,393,502 people shows a slight positive correlation between the proportion of Carpatho Rusyns and poverty level among single males in the United States with a correlation coefficient (R) of 0.059 and weighted average of 13.4%. Similarly, the statistical analysis conducted on geographies consisting of 451,233,514 people shows a strong positive correlation between the proportion of Puerto Ricans and poverty level among single males in the United States with a correlation coefficient (R) of 0.782 and weighted average of 25.1%, a difference of 86.5%.
Single Male Poverty Correlation Summary
| Measurement | Carpatho Rusyn | Puerto Rican |
| Minimum | 5.7% | 5.9% |
| Maximum | 25.6% | 66.0% |
| Range | 19.9% | 60.0% |
| Mean | 15.5% | 24.3% |
| Median | 14.7% | 17.6% |
| Interquartile 25% (IQ1) | 12.3% | 14.2% |
| Interquartile 75% (IQ3) | 18.3% | 31.7% |
| Interquartile Range (IQR) | 6.0% | 17.6% |
| Standard Deviation (Sample) | 6.2% | 14.8% |
| Standard Deviation (Population) | 6.1% | 14.8% |
Similar Demographics by Single Male Poverty
Demographics Similar to Carpatho Rusyns by Single Male Poverty
In terms of single male poverty, the demographic groups most similar to Carpatho Rusyns are Immigrants from Germany (13.4%, a difference of 0.010%), Barbadian (13.4%, a difference of 0.050%), Belizean (13.4%, a difference of 0.12%), Immigrants from Senegal (13.5%, a difference of 0.32%), and Czechoslovakian (13.4%, a difference of 0.43%).
| Demographics | Rating | Rank | Single Male Poverty |
| Bangladeshis | 3.7 /100 | #235 | Tragic 13.3% |
| Luxembourgers | 3.6 /100 | #236 | Tragic 13.4% |
| British West Indians | 3.4 /100 | #237 | Tragic 13.4% |
| Immigrants | Ghana | 3.2 /100 | #238 | Tragic 13.4% |
| Czechoslovakians | 3.0 /100 | #239 | Tragic 13.4% |
| Belizeans | 2.3 /100 | #240 | Tragic 13.4% |
| Immigrants | Germany | 2.1 /100 | #241 | Tragic 13.4% |
| Carpatho Rusyns | 2.1 /100 | #242 | Tragic 13.4% |
| Barbadians | 2.1 /100 | #243 | Tragic 13.4% |
| Immigrants | Senegal | 1.7 /100 | #244 | Tragic 13.5% |
| Immigrants | Latin America | 1.3 /100 | #245 | Tragic 13.5% |
| Immigrants | Micronesia | 1.2 /100 | #246 | Tragic 13.5% |
| Belgians | 1.2 /100 | #247 | Tragic 13.5% |
| Czechs | 1.2 /100 | #248 | Tragic 13.5% |
| Spanish | 1.0 /100 | #249 | Tragic 13.6% |
Demographics Similar to Puerto Ricans by Single Male Poverty
In terms of single male poverty, the demographic groups most similar to Puerto Ricans are Lumbee (25.2%, a difference of 0.31%), Navajo (25.3%, a difference of 1.1%), Houma (23.5%, a difference of 6.9%), Crow (23.3%, a difference of 7.8%), and Hopi (27.5%, a difference of 9.7%).
| Demographics | Rating | Rank | Single Male Poverty |
| Inupiat | 0.0 /100 | #333 | Tragic 20.0% |
| Pima | 0.0 /100 | #334 | Tragic 20.2% |
| Yuman | 0.0 /100 | #335 | Tragic 21.3% |
| Tohono O'odham | 0.0 /100 | #336 | Tragic 21.6% |
| Apache | 0.0 /100 | #337 | Tragic 21.6% |
| Pueblo | 0.0 /100 | #338 | Tragic 21.6% |
| Arapaho | 0.0 /100 | #339 | Tragic 21.9% |
| Sioux | 0.0 /100 | #340 | Tragic 22.2% |
| Crow | 0.0 /100 | #341 | Tragic 23.3% |
| Houma | 0.0 /100 | #342 | Tragic 23.5% |
| Puerto Ricans | 0.0 /100 | #343 | Tragic 25.1% |
| Lumbee | 0.0 /100 | #344 | Tragic 25.2% |
| Navajo | 0.0 /100 | #345 | Tragic 25.3% |
| Hopi | 0.0 /100 | #346 | Tragic 27.5% |
| Yup'ik | 0.0 /100 | #347 | Tragic 31.6% |