Immigrants from Yemen vs Puerto Rican Single Male Poverty
COMPARE
Immigrants from Yemen
Puerto Rican
Single Male Poverty
Single Male Poverty Comparison
Immigrants from Yemen
Puerto Ricans
16.9%
SINGLE MALE POVERTY
0.0/ 100
METRIC RATING
324th/ 347
METRIC RANK
25.1%
SINGLE MALE POVERTY
0.0/ 100
METRIC RATING
343rd/ 347
METRIC RANK
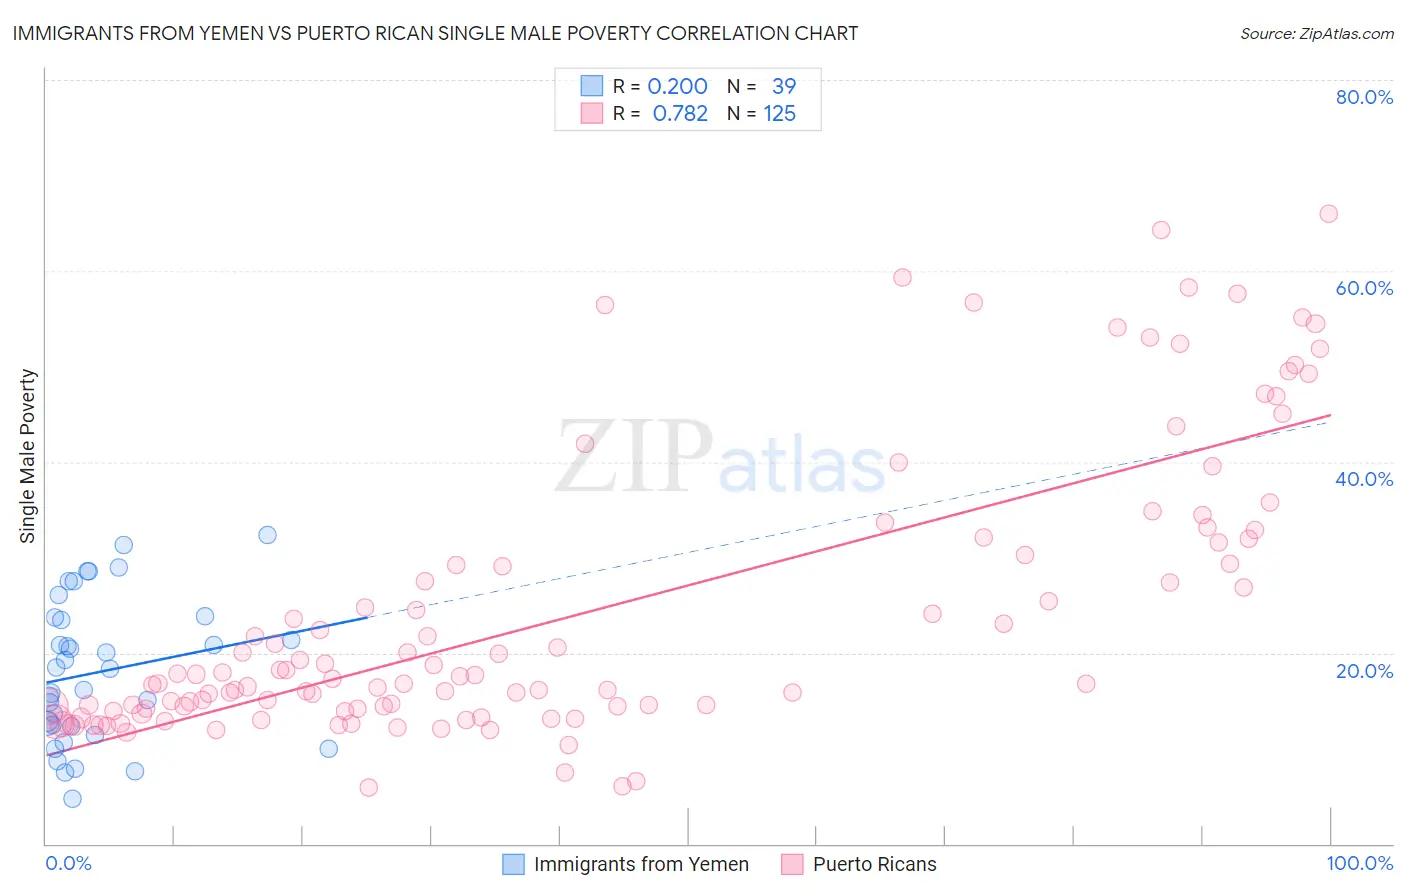
Immigrants from Yemen vs Puerto Rican Single Male Poverty Correlation Chart
The statistical analysis conducted on geographies consisting of 80,158,341 people shows a poor positive correlation between the proportion of Immigrants from Yemen and poverty level among single males in the United States with a correlation coefficient (R) of 0.200 and weighted average of 16.9%. Similarly, the statistical analysis conducted on geographies consisting of 451,233,514 people shows a strong positive correlation between the proportion of Puerto Ricans and poverty level among single males in the United States with a correlation coefficient (R) of 0.782 and weighted average of 25.1%, a difference of 48.7%.
Single Male Poverty Correlation Summary
| Measurement | Immigrants from Yemen | Puerto Rican |
| Minimum | 4.7% | 5.9% |
| Maximum | 32.4% | 66.0% |
| Range | 27.7% | 60.0% |
| Mean | 18.0% | 24.3% |
| Median | 18.3% | 17.6% |
| Interquartile 25% (IQ1) | 12.3% | 14.2% |
| Interquartile 75% (IQ3) | 23.7% | 31.7% |
| Interquartile Range (IQR) | 11.4% | 17.6% |
| Standard Deviation (Sample) | 7.4% | 14.8% |
| Standard Deviation (Population) | 7.3% | 14.8% |
Demographics Similar to Immigrants from Yemen and Puerto Ricans by Single Male Poverty
In terms of single male poverty, the demographic groups most similar to Immigrants from Yemen are Creek (16.8%, a difference of 0.11%), Choctaw (17.0%, a difference of 0.72%), Central American Indian (17.2%, a difference of 2.3%), Menominee (17.7%, a difference of 5.1%), and Kiowa (18.3%, a difference of 8.5%). Similarly, the demographic groups most similar to Puerto Ricans are Houma (23.5%, a difference of 6.9%), Crow (23.3%, a difference of 7.8%), Sioux (22.2%, a difference of 12.9%), Arapaho (21.9%, a difference of 14.3%), and Pueblo (21.6%, a difference of 16.0%).
| Demographics | Rating | Rank | Single Male Poverty |
| Creek | 0.0 /100 | #323 | Tragic 16.8% |
| Immigrants | Yemen | 0.0 /100 | #324 | Tragic 16.9% |
| Choctaw | 0.0 /100 | #325 | Tragic 17.0% |
| Central American Indians | 0.0 /100 | #326 | Tragic 17.2% |
| Menominee | 0.0 /100 | #327 | Tragic 17.7% |
| Kiowa | 0.0 /100 | #328 | Tragic 18.3% |
| Colville | 0.0 /100 | #329 | Tragic 18.4% |
| Cajuns | 0.0 /100 | #330 | Tragic 19.1% |
| Paiute | 0.0 /100 | #331 | Tragic 19.3% |
| Natives/Alaskans | 0.0 /100 | #332 | Tragic 19.6% |
| Inupiat | 0.0 /100 | #333 | Tragic 20.0% |
| Pima | 0.0 /100 | #334 | Tragic 20.2% |
| Yuman | 0.0 /100 | #335 | Tragic 21.3% |
| Tohono O'odham | 0.0 /100 | #336 | Tragic 21.6% |
| Apache | 0.0 /100 | #337 | Tragic 21.6% |
| Pueblo | 0.0 /100 | #338 | Tragic 21.6% |
| Arapaho | 0.0 /100 | #339 | Tragic 21.9% |
| Sioux | 0.0 /100 | #340 | Tragic 22.2% |
| Crow | 0.0 /100 | #341 | Tragic 23.3% |
| Houma | 0.0 /100 | #342 | Tragic 23.5% |
| Puerto Ricans | 0.0 /100 | #343 | Tragic 25.1% |