Ute vs Celtic Female Poverty
COMPARE
Ute
Celtic
Female Poverty
Female Poverty Comparison
Ute
Celtics
17.5%
FEMALE POVERTY
0.0/ 100
METRIC RATING
318th/ 347
METRIC RANK
13.4%
FEMALE POVERTY
49.9/ 100
METRIC RATING
175th/ 347
METRIC RANK
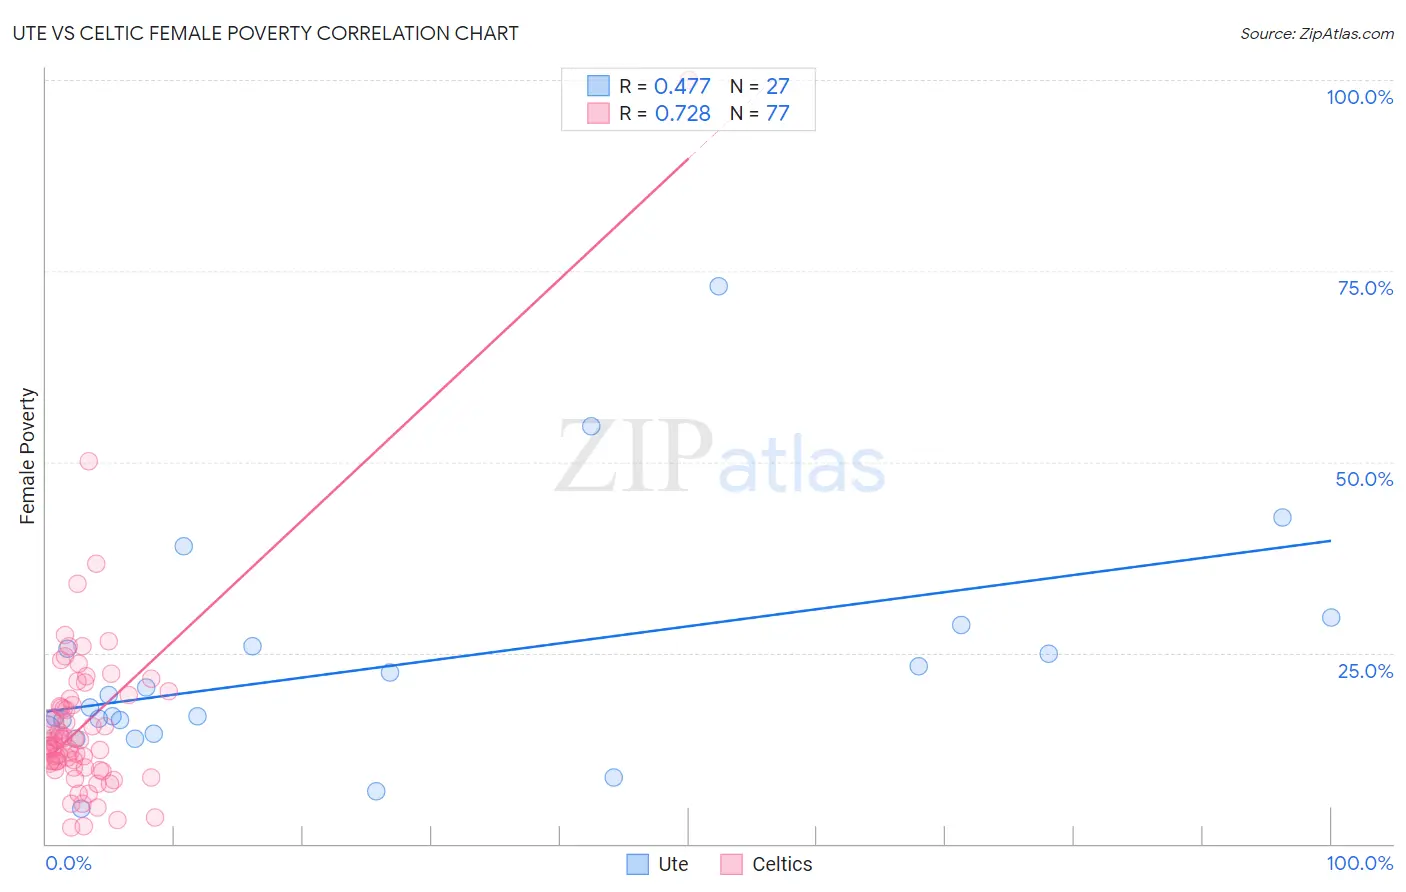
Ute vs Celtic Female Poverty Correlation Chart
The statistical analysis conducted on geographies consisting of 55,666,863 people shows a moderate positive correlation between the proportion of Ute and poverty level among females in the United States with a correlation coefficient (R) of 0.477 and weighted average of 17.5%. Similarly, the statistical analysis conducted on geographies consisting of 168,846,795 people shows a strong positive correlation between the proportion of Celtics and poverty level among females in the United States with a correlation coefficient (R) of 0.728 and weighted average of 13.4%, a difference of 29.8%.
Female Poverty Correlation Summary
| Measurement | Ute | Celtic |
| Minimum | 4.6% | 2.2% |
| Maximum | 73.0% | 100.0% |
| Range | 68.4% | 97.8% |
| Mean | 23.1% | 15.9% |
| Median | 17.9% | 12.9% |
| Interquartile 25% (IQ1) | 15.1% | 10.3% |
| Interquartile 75% (IQ3) | 25.9% | 18.6% |
| Interquartile Range (IQR) | 10.9% | 8.3% |
| Standard Deviation (Sample) | 14.7% | 12.5% |
| Standard Deviation (Population) | 14.5% | 12.5% |
Similar Demographics by Female Poverty
Demographics Similar to Ute by Female Poverty
In terms of female poverty, the demographic groups most similar to Ute are Cajun (17.5%, a difference of 0.010%), Immigrants from Dominica (17.5%, a difference of 0.10%), Arapaho (17.5%, a difference of 0.16%), Immigrants from Congo (17.4%, a difference of 0.32%), and Honduran (17.4%, a difference of 0.52%).
| Demographics | Rating | Rank | Female Poverty |
| Immigrants | Guatemala | 0.0 /100 | #311 | Tragic 17.0% |
| Immigrants | Somalia | 0.0 /100 | #312 | Tragic 17.0% |
| British West Indians | 0.0 /100 | #313 | Tragic 17.0% |
| Dutch West Indians | 0.0 /100 | #314 | Tragic 17.1% |
| U.S. Virgin Islanders | 0.0 /100 | #315 | Tragic 17.3% |
| Hondurans | 0.0 /100 | #316 | Tragic 17.4% |
| Immigrants | Congo | 0.0 /100 | #317 | Tragic 17.4% |
| Ute | 0.0 /100 | #318 | Tragic 17.5% |
| Cajuns | 0.0 /100 | #319 | Tragic 17.5% |
| Immigrants | Dominica | 0.0 /100 | #320 | Tragic 17.5% |
| Arapaho | 0.0 /100 | #321 | Tragic 17.5% |
| Menominee | 0.0 /100 | #322 | Tragic 17.6% |
| Paiute | 0.0 /100 | #323 | Tragic 17.7% |
| Immigrants | Honduras | 0.0 /100 | #324 | Tragic 17.7% |
| Colville | 0.0 /100 | #325 | Tragic 17.8% |
Demographics Similar to Celtics by Female Poverty
In terms of female poverty, the demographic groups most similar to Celtics are Immigrants from Spain (13.4%, a difference of 0.0%), Immigrants from Iraq (13.4%, a difference of 0.010%), Immigrants from Morocco (13.4%, a difference of 0.050%), Immigrants from Afghanistan (13.4%, a difference of 0.080%), and Israeli (13.5%, a difference of 0.080%).
| Demographics | Rating | Rank | Female Poverty |
| Aleuts | 56.7 /100 | #168 | Average 13.4% |
| Lebanese | 55.9 /100 | #169 | Average 13.4% |
| Colombians | 55.7 /100 | #170 | Average 13.4% |
| Whites/Caucasians | 54.6 /100 | #171 | Average 13.4% |
| Mongolians | 53.6 /100 | #172 | Average 13.4% |
| Immigrants | Afghanistan | 50.8 /100 | #173 | Average 13.4% |
| Immigrants | Iraq | 50.0 /100 | #174 | Average 13.4% |
| Celtics | 49.9 /100 | #175 | Average 13.4% |
| Immigrants | Spain | 49.9 /100 | #176 | Average 13.4% |
| Immigrants | Morocco | 49.4 /100 | #177 | Average 13.4% |
| Israelis | 49.1 /100 | #178 | Average 13.5% |
| Immigrants | Syria | 48.8 /100 | #179 | Average 13.5% |
| South Americans | 44.8 /100 | #180 | Average 13.5% |
| Venezuelans | 44.5 /100 | #181 | Average 13.5% |
| Immigrants | Colombia | 44.5 /100 | #182 | Average 13.5% |