Ute vs Barbadian Female Poverty
COMPARE
Ute
Barbadian
Female Poverty
Female Poverty Comparison
Ute
Barbadians
17.5%
FEMALE POVERTY
0.0/ 100
METRIC RATING
318th/ 347
METRIC RANK
15.9%
FEMALE POVERTY
0.0/ 100
METRIC RATING
274th/ 347
METRIC RANK
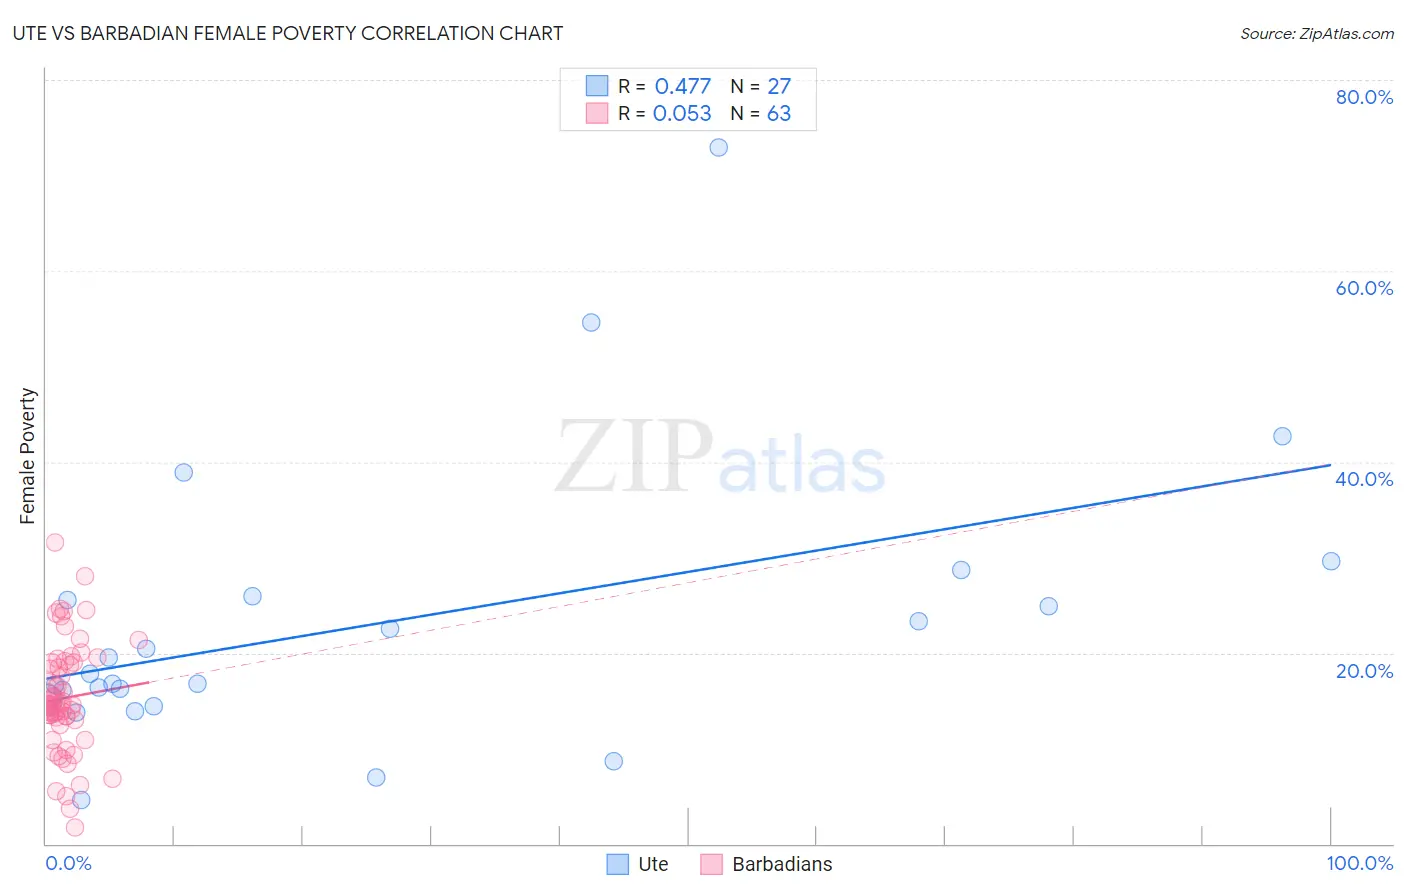
Ute vs Barbadian Female Poverty Correlation Chart
The statistical analysis conducted on geographies consisting of 55,666,863 people shows a moderate positive correlation between the proportion of Ute and poverty level among females in the United States with a correlation coefficient (R) of 0.477 and weighted average of 17.5%. Similarly, the statistical analysis conducted on geographies consisting of 141,263,328 people shows a slight positive correlation between the proportion of Barbadians and poverty level among females in the United States with a correlation coefficient (R) of 0.053 and weighted average of 15.9%, a difference of 9.5%.
Female Poverty Correlation Summary
| Measurement | Ute | Barbadian |
| Minimum | 4.6% | 1.7% |
| Maximum | 73.0% | 31.5% |
| Range | 68.4% | 29.8% |
| Mean | 23.1% | 15.3% |
| Median | 17.9% | 14.6% |
| Interquartile 25% (IQ1) | 15.1% | 13.0% |
| Interquartile 75% (IQ3) | 25.9% | 18.9% |
| Interquartile Range (IQR) | 10.9% | 5.9% |
| Standard Deviation (Sample) | 14.7% | 5.8% |
| Standard Deviation (Population) | 14.5% | 5.8% |
Similar Demographics by Female Poverty
Demographics Similar to Ute by Female Poverty
In terms of female poverty, the demographic groups most similar to Ute are Cajun (17.5%, a difference of 0.010%), Immigrants from Dominica (17.5%, a difference of 0.10%), Arapaho (17.5%, a difference of 0.16%), Immigrants from Congo (17.4%, a difference of 0.32%), and Honduran (17.4%, a difference of 0.52%).
| Demographics | Rating | Rank | Female Poverty |
| Immigrants | Guatemala | 0.0 /100 | #311 | Tragic 17.0% |
| Immigrants | Somalia | 0.0 /100 | #312 | Tragic 17.0% |
| British West Indians | 0.0 /100 | #313 | Tragic 17.0% |
| Dutch West Indians | 0.0 /100 | #314 | Tragic 17.1% |
| U.S. Virgin Islanders | 0.0 /100 | #315 | Tragic 17.3% |
| Hondurans | 0.0 /100 | #316 | Tragic 17.4% |
| Immigrants | Congo | 0.0 /100 | #317 | Tragic 17.4% |
| Ute | 0.0 /100 | #318 | Tragic 17.5% |
| Cajuns | 0.0 /100 | #319 | Tragic 17.5% |
| Immigrants | Dominica | 0.0 /100 | #320 | Tragic 17.5% |
| Arapaho | 0.0 /100 | #321 | Tragic 17.5% |
| Menominee | 0.0 /100 | #322 | Tragic 17.6% |
| Paiute | 0.0 /100 | #323 | Tragic 17.7% |
| Immigrants | Honduras | 0.0 /100 | #324 | Tragic 17.7% |
| Colville | 0.0 /100 | #325 | Tragic 17.8% |
Demographics Similar to Barbadians by Female Poverty
In terms of female poverty, the demographic groups most similar to Barbadians are Haitian (15.9%, a difference of 0.0%), Belizean (15.9%, a difference of 0.010%), Immigrants from Barbados (16.0%, a difference of 0.070%), Central American (16.0%, a difference of 0.19%), and Immigrants from St. Vincent and the Grenadines (15.9%, a difference of 0.24%).
| Demographics | Rating | Rank | Female Poverty |
| Sub-Saharan Africans | 0.1 /100 | #267 | Tragic 15.8% |
| Immigrants | Nicaragua | 0.1 /100 | #268 | Tragic 15.8% |
| Iroquois | 0.1 /100 | #269 | Tragic 15.8% |
| Chickasaw | 0.1 /100 | #270 | Tragic 15.9% |
| Immigrants | St. Vincent and the Grenadines | 0.0 /100 | #271 | Tragic 15.9% |
| Belizeans | 0.0 /100 | #272 | Tragic 15.9% |
| Haitians | 0.0 /100 | #273 | Tragic 15.9% |
| Barbadians | 0.0 /100 | #274 | Tragic 15.9% |
| Immigrants | Barbados | 0.0 /100 | #275 | Tragic 16.0% |
| Central Americans | 0.0 /100 | #276 | Tragic 16.0% |
| Bangladeshis | 0.0 /100 | #277 | Tragic 16.0% |
| Immigrants | West Indies | 0.0 /100 | #278 | Tragic 16.1% |
| Immigrants | Bahamas | 0.0 /100 | #279 | Tragic 16.1% |
| Vietnamese | 0.0 /100 | #280 | Tragic 16.1% |
| West Indians | 0.0 /100 | #281 | Tragic 16.1% |