Ute vs Dutch Female Poverty
COMPARE
Ute
Dutch
Female Poverty
Female Poverty Comparison
Ute
Dutch
17.5%
FEMALE POVERTY
0.0/ 100
METRIC RATING
318th/ 347
METRIC RANK
12.4%
FEMALE POVERTY
96.5/ 100
METRIC RATING
86th/ 347
METRIC RANK
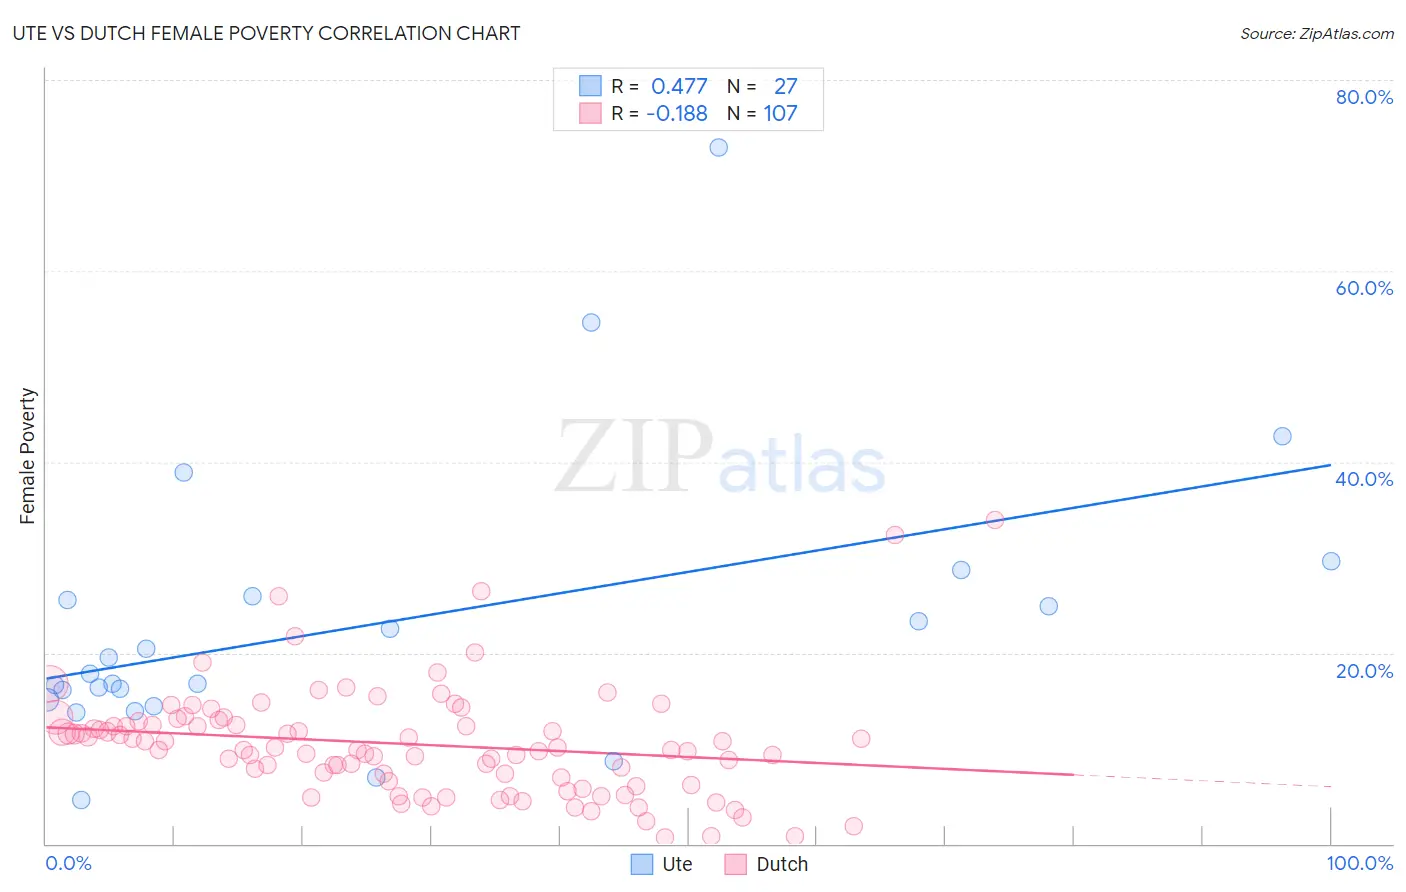
Ute vs Dutch Female Poverty Correlation Chart
The statistical analysis conducted on geographies consisting of 55,666,863 people shows a moderate positive correlation between the proportion of Ute and poverty level among females in the United States with a correlation coefficient (R) of 0.477 and weighted average of 17.5%. Similarly, the statistical analysis conducted on geographies consisting of 553,347,784 people shows a poor negative correlation between the proportion of Dutch and poverty level among females in the United States with a correlation coefficient (R) of -0.188 and weighted average of 12.4%, a difference of 41.1%.
Female Poverty Correlation Summary
| Measurement | Ute | Dutch |
| Minimum | 4.6% | 0.60% |
| Maximum | 73.0% | 33.9% |
| Range | 68.4% | 33.3% |
| Mean | 23.1% | 10.5% |
| Median | 17.9% | 9.9% |
| Interquartile 25% (IQ1) | 15.1% | 6.5% |
| Interquartile 75% (IQ3) | 25.9% | 12.8% |
| Interquartile Range (IQR) | 10.9% | 6.3% |
| Standard Deviation (Sample) | 14.7% | 5.8% |
| Standard Deviation (Population) | 14.5% | 5.7% |
Similar Demographics by Female Poverty
Demographics Similar to Ute by Female Poverty
In terms of female poverty, the demographic groups most similar to Ute are Cajun (17.5%, a difference of 0.010%), Immigrants from Dominica (17.5%, a difference of 0.10%), Arapaho (17.5%, a difference of 0.16%), Immigrants from Congo (17.4%, a difference of 0.32%), and Honduran (17.4%, a difference of 0.52%).
| Demographics | Rating | Rank | Female Poverty |
| Immigrants | Guatemala | 0.0 /100 | #311 | Tragic 17.0% |
| Immigrants | Somalia | 0.0 /100 | #312 | Tragic 17.0% |
| British West Indians | 0.0 /100 | #313 | Tragic 17.0% |
| Dutch West Indians | 0.0 /100 | #314 | Tragic 17.1% |
| U.S. Virgin Islanders | 0.0 /100 | #315 | Tragic 17.3% |
| Hondurans | 0.0 /100 | #316 | Tragic 17.4% |
| Immigrants | Congo | 0.0 /100 | #317 | Tragic 17.4% |
| Ute | 0.0 /100 | #318 | Tragic 17.5% |
| Cajuns | 0.0 /100 | #319 | Tragic 17.5% |
| Immigrants | Dominica | 0.0 /100 | #320 | Tragic 17.5% |
| Arapaho | 0.0 /100 | #321 | Tragic 17.5% |
| Menominee | 0.0 /100 | #322 | Tragic 17.6% |
| Paiute | 0.0 /100 | #323 | Tragic 17.7% |
| Immigrants | Honduras | 0.0 /100 | #324 | Tragic 17.7% |
| Colville | 0.0 /100 | #325 | Tragic 17.8% |
Demographics Similar to Dutch by Female Poverty
In terms of female poverty, the demographic groups most similar to Dutch are Okinawan (12.4%, a difference of 0.020%), Irish (12.4%, a difference of 0.030%), Finnish (12.4%, a difference of 0.060%), Northern European (12.4%, a difference of 0.080%), and English (12.4%, a difference of 0.26%).
| Demographics | Rating | Rank | Female Poverty |
| Immigrants | North America | 97.1 /100 | #79 | Exceptional 12.3% |
| Slovaks | 97.1 /100 | #80 | Exceptional 12.3% |
| Immigrants | Sweden | 97.1 /100 | #81 | Exceptional 12.3% |
| Jordanians | 97.1 /100 | #82 | Exceptional 12.3% |
| Immigrants | England | 96.9 /100 | #83 | Exceptional 12.3% |
| Northern Europeans | 96.6 /100 | #84 | Exceptional 12.4% |
| Irish | 96.5 /100 | #85 | Exceptional 12.4% |
| Dutch | 96.5 /100 | #86 | Exceptional 12.4% |
| Okinawans | 96.4 /100 | #87 | Exceptional 12.4% |
| Finns | 96.4 /100 | #88 | Exceptional 12.4% |
| English | 96.1 /100 | #89 | Exceptional 12.4% |
| Immigrants | Denmark | 95.8 /100 | #90 | Exceptional 12.4% |
| Belgians | 95.8 /100 | #91 | Exceptional 12.4% |
| Czechoslovakians | 95.7 /100 | #92 | Exceptional 12.4% |
| Immigrants | Egypt | 95.5 /100 | #93 | Exceptional 12.5% |