South American Indian vs Celtic Female Poverty
COMPARE
South American Indian
Celtic
Female Poverty
Female Poverty Comparison
South American Indians
Celtics
13.7%
FEMALE POVERTY
28.9/ 100
METRIC RATING
196th/ 347
METRIC RANK
13.4%
FEMALE POVERTY
49.9/ 100
METRIC RATING
175th/ 347
METRIC RANK
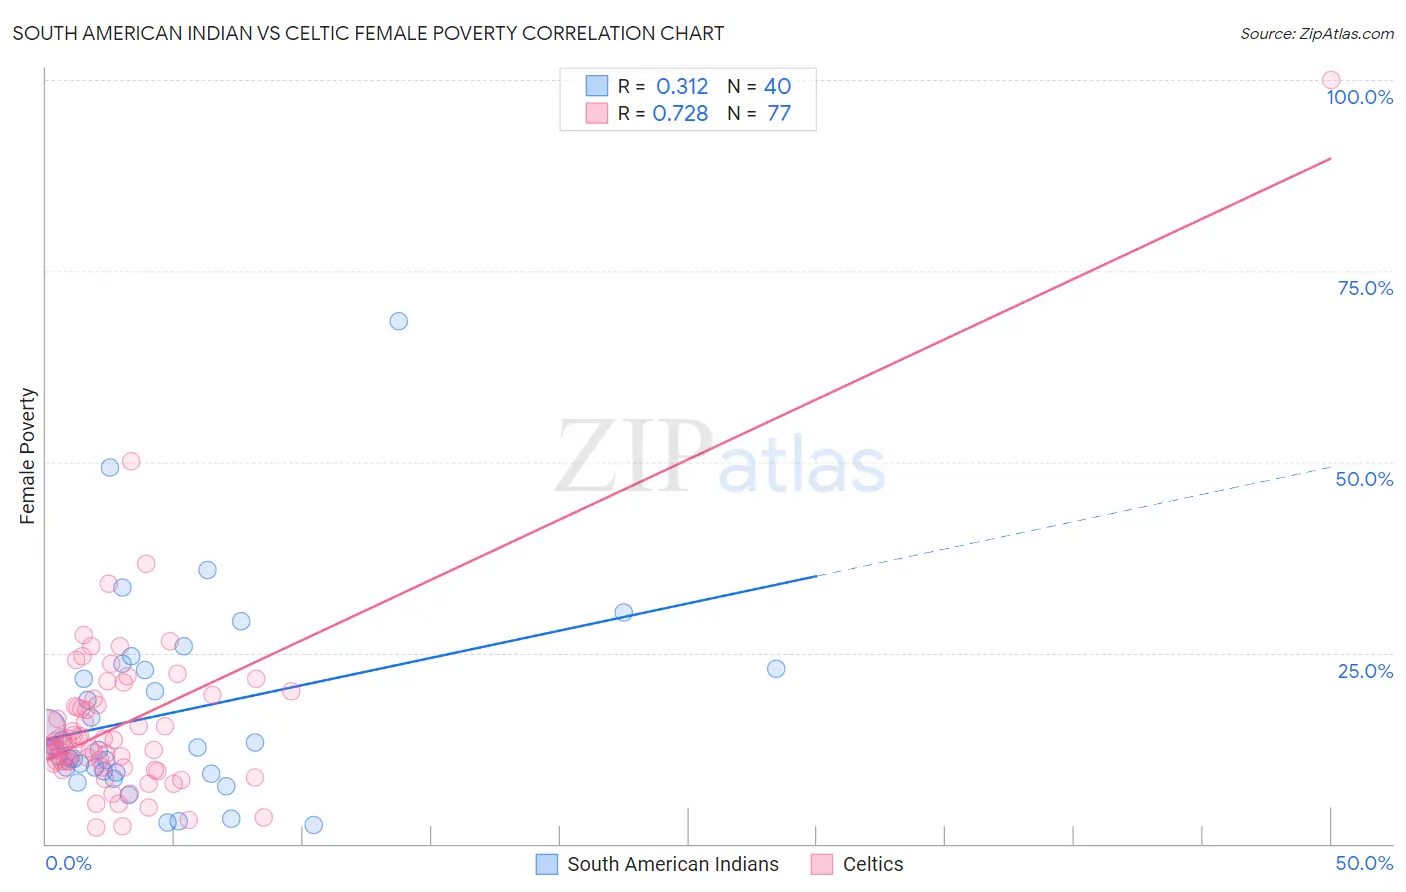
South American Indian vs Celtic Female Poverty Correlation Chart
The statistical analysis conducted on geographies consisting of 164,514,214 people shows a mild positive correlation between the proportion of South American Indians and poverty level among females in the United States with a correlation coefficient (R) of 0.312 and weighted average of 13.7%. Similarly, the statistical analysis conducted on geographies consisting of 168,846,795 people shows a strong positive correlation between the proportion of Celtics and poverty level among females in the United States with a correlation coefficient (R) of 0.728 and weighted average of 13.4%, a difference of 2.1%.
Female Poverty Correlation Summary
| Measurement | South American Indian | Celtic |
| Minimum | 2.4% | 2.2% |
| Maximum | 68.3% | 100.0% |
| Range | 65.9% | 97.8% |
| Mean | 17.0% | 15.9% |
| Median | 12.5% | 12.9% |
| Interquartile 25% (IQ1) | 9.4% | 10.3% |
| Interquartile 75% (IQ3) | 22.8% | 18.6% |
| Interquartile Range (IQR) | 13.4% | 8.3% |
| Standard Deviation (Sample) | 13.0% | 12.5% |
| Standard Deviation (Population) | 12.9% | 12.5% |
Similar Demographics by Female Poverty
Demographics Similar to South American Indians by Female Poverty
In terms of female poverty, the demographic groups most similar to South American Indians are Arab (13.7%, a difference of 0.040%), Immigrants from Uganda (13.7%, a difference of 0.060%), Immigrants from South America (13.7%, a difference of 0.19%), Delaware (13.7%, a difference of 0.25%), and Iraqi (13.7%, a difference of 0.31%).
| Demographics | Rating | Rank | Female Poverty |
| Uruguayans | 39.8 /100 | #189 | Fair 13.6% |
| Sierra Leoneans | 33.1 /100 | #190 | Fair 13.7% |
| Immigrants | Kuwait | 32.7 /100 | #191 | Fair 13.7% |
| Immigrants | Costa Rica | 31.9 /100 | #192 | Fair 13.7% |
| Iraqis | 31.8 /100 | #193 | Fair 13.7% |
| Delaware | 31.1 /100 | #194 | Fair 13.7% |
| Immigrants | South America | 30.6 /100 | #195 | Fair 13.7% |
| South American Indians | 28.9 /100 | #196 | Fair 13.7% |
| Arabs | 28.6 /100 | #197 | Fair 13.7% |
| Immigrants | Uganda | 28.5 /100 | #198 | Fair 13.7% |
| Immigrants | Lebanon | 25.6 /100 | #199 | Fair 13.8% |
| Spanish | 21.4 /100 | #200 | Fair 13.9% |
| Immigrants | Kenya | 21.1 /100 | #201 | Fair 13.9% |
| Hmong | 21.1 /100 | #202 | Fair 13.9% |
| Immigrants | Western Asia | 20.7 /100 | #203 | Fair 13.9% |
Demographics Similar to Celtics by Female Poverty
In terms of female poverty, the demographic groups most similar to Celtics are Immigrants from Spain (13.4%, a difference of 0.0%), Immigrants from Iraq (13.4%, a difference of 0.010%), Immigrants from Morocco (13.4%, a difference of 0.050%), Immigrants from Afghanistan (13.4%, a difference of 0.080%), and Israeli (13.5%, a difference of 0.080%).
| Demographics | Rating | Rank | Female Poverty |
| Aleuts | 56.7 /100 | #168 | Average 13.4% |
| Lebanese | 55.9 /100 | #169 | Average 13.4% |
| Colombians | 55.7 /100 | #170 | Average 13.4% |
| Whites/Caucasians | 54.6 /100 | #171 | Average 13.4% |
| Mongolians | 53.6 /100 | #172 | Average 13.4% |
| Immigrants | Afghanistan | 50.8 /100 | #173 | Average 13.4% |
| Immigrants | Iraq | 50.0 /100 | #174 | Average 13.4% |
| Celtics | 49.9 /100 | #175 | Average 13.4% |
| Immigrants | Spain | 49.9 /100 | #176 | Average 13.4% |
| Immigrants | Morocco | 49.4 /100 | #177 | Average 13.4% |
| Israelis | 49.1 /100 | #178 | Average 13.5% |
| Immigrants | Syria | 48.8 /100 | #179 | Average 13.5% |
| South Americans | 44.8 /100 | #180 | Average 13.5% |
| Venezuelans | 44.5 /100 | #181 | Average 13.5% |
| Immigrants | Colombia | 44.5 /100 | #182 | Average 13.5% |