U.S. Virgin Islander vs Puerto Rican Single Father Poverty
COMPARE
U.S. Virgin Islander
Puerto Rican
Single Father Poverty
Single Father Poverty Comparison
U.S. Virgin Islanders
Puerto Ricans
18.1%
SINGLE FATHER POVERTY
0.0/ 100
METRIC RATING
294th/ 347
METRIC RANK
31.5%
SINGLE FATHER POVERTY
0.0/ 100
METRIC RATING
346th/ 347
METRIC RANK
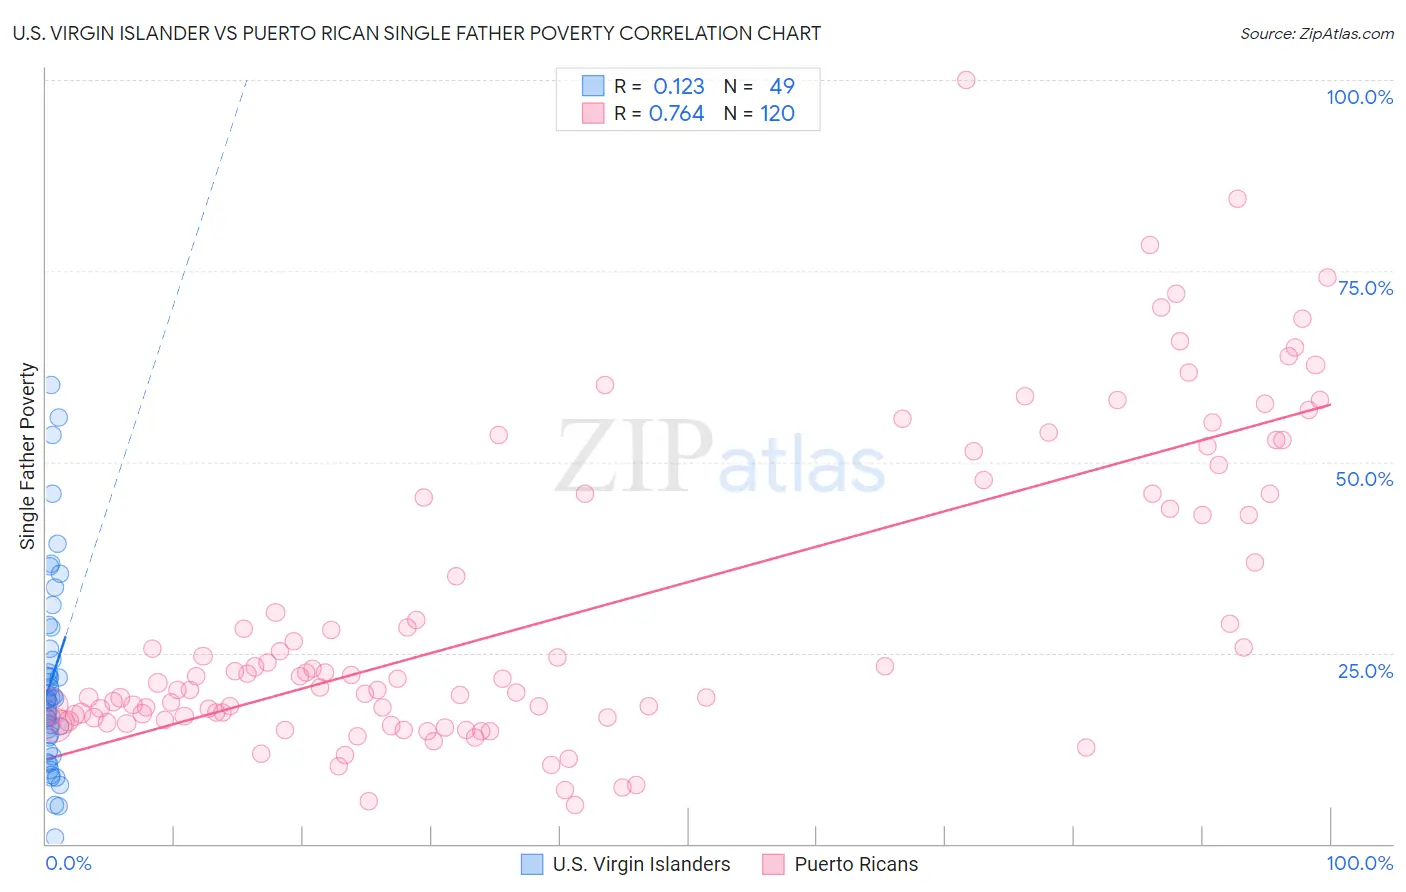
U.S. Virgin Islander vs Puerto Rican Single Father Poverty Correlation Chart
The statistical analysis conducted on geographies consisting of 82,675,302 people shows a poor positive correlation between the proportion of U.S. Virgin Islanders and poverty level among single fathers in the United States with a correlation coefficient (R) of 0.123 and weighted average of 18.1%. Similarly, the statistical analysis conducted on geographies consisting of 394,843,962 people shows a strong positive correlation between the proportion of Puerto Ricans and poverty level among single fathers in the United States with a correlation coefficient (R) of 0.764 and weighted average of 31.5%, a difference of 74.0%.
Single Father Poverty Correlation Summary
| Measurement | U.S. Virgin Islander | Puerto Rican |
| Minimum | 0.75% | 5.1% |
| Maximum | 60.0% | 100.0% |
| Range | 59.2% | 94.9% |
| Mean | 21.5% | 30.4% |
| Median | 19.0% | 21.8% |
| Interquartile 25% (IQ1) | 13.1% | 16.6% |
| Interquartile 75% (IQ3) | 26.9% | 45.8% |
| Interquartile Range (IQR) | 13.8% | 29.2% |
| Standard Deviation (Sample) | 13.1% | 20.1% |
| Standard Deviation (Population) | 12.9% | 20.0% |
Similar Demographics by Single Father Poverty
Demographics Similar to U.S. Virgin Islanders by Single Father Poverty
In terms of single father poverty, the demographic groups most similar to U.S. Virgin Islanders are Alaska Native (18.1%, a difference of 0.030%), Yakama (18.1%, a difference of 0.060%), Immigrants from Bahamas (18.1%, a difference of 0.13%), Alaskan Athabascan (18.1%, a difference of 0.14%), and Seminole (18.1%, a difference of 0.17%).
| Demographics | Rating | Rank | Single Father Poverty |
| Carpatho Rusyns | 0.0 /100 | #287 | Tragic 18.0% |
| Bahamians | 0.0 /100 | #288 | Tragic 18.0% |
| Irish | 0.0 /100 | #289 | Tragic 18.0% |
| West Indians | 0.0 /100 | #290 | Tragic 18.0% |
| Alaskan Athabascans | 0.0 /100 | #291 | Tragic 18.1% |
| Immigrants | Bahamas | 0.0 /100 | #292 | Tragic 18.1% |
| Alaska Natives | 0.0 /100 | #293 | Tragic 18.1% |
| U.S. Virgin Islanders | 0.0 /100 | #294 | Tragic 18.1% |
| Yakama | 0.0 /100 | #295 | Tragic 18.1% |
| Seminole | 0.0 /100 | #296 | Tragic 18.1% |
| French | 0.0 /100 | #297 | Tragic 18.2% |
| Africans | 0.0 /100 | #298 | Tragic 18.3% |
| Whites/Caucasians | 0.0 /100 | #299 | Tragic 18.4% |
| Immigrants | Dominican Republic | 0.0 /100 | #300 | Tragic 18.4% |
| Hungarians | 0.0 /100 | #301 | Tragic 18.5% |
Demographics Similar to Puerto Ricans by Single Father Poverty
In terms of single father poverty, the demographic groups most similar to Puerto Ricans are Yup'ik (32.5%, a difference of 3.2%), Crow (30.3%, a difference of 4.1%), Navajo (29.2%, a difference of 7.9%), Lumbee (28.5%, a difference of 10.7%), and Yuman (28.4%, a difference of 11.0%).
| Demographics | Rating | Rank | Single Father Poverty |
| Natives/Alaskans | 0.0 /100 | #333 | Tragic 22.4% |
| Kiowa | 0.0 /100 | #334 | Tragic 22.5% |
| Shoshone | 0.0 /100 | #335 | Tragic 22.9% |
| Cajuns | 0.0 /100 | #336 | Tragic 23.1% |
| Sioux | 0.0 /100 | #337 | Tragic 23.9% |
| Arapaho | 0.0 /100 | #338 | Tragic 24.0% |
| Apache | 0.0 /100 | #339 | Tragic 24.2% |
| Houma | 0.0 /100 | #340 | Tragic 26.7% |
| Hopi | 0.0 /100 | #341 | Tragic 27.2% |
| Yuman | 0.0 /100 | #342 | Tragic 28.4% |
| Lumbee | 0.0 /100 | #343 | Tragic 28.5% |
| Navajo | 0.0 /100 | #344 | Tragic 29.2% |
| Crow | 0.0 /100 | #345 | Tragic 30.3% |
| Puerto Ricans | 0.0 /100 | #346 | Tragic 31.5% |
| Yup'ik | 0.0 /100 | #347 | Tragic 32.5% |