U.S. Virgin Islander vs Immigrants from Dominica Single Father Poverty
COMPARE
U.S. Virgin Islander
Immigrants from Dominica
Single Father Poverty
Single Father Poverty Comparison
U.S. Virgin Islanders
Immigrants from Dominica
18.1%
SINGLE FATHER POVERTY
0.0/ 100
METRIC RATING
294th/ 347
METRIC RANK
18.9%
SINGLE FATHER POVERTY
0.0/ 100
METRIC RATING
312th/ 347
METRIC RANK
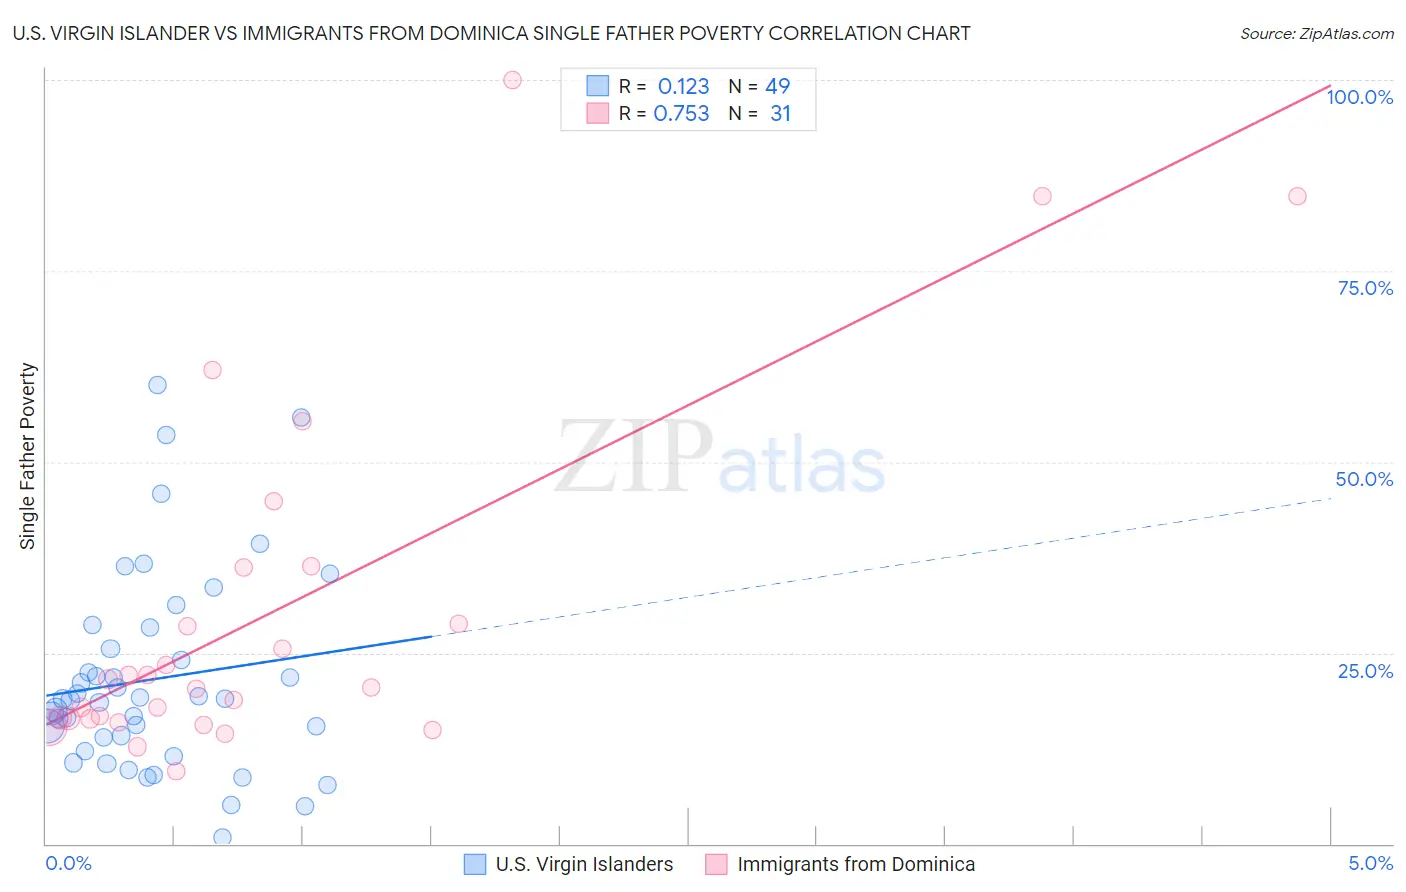
U.S. Virgin Islander vs Immigrants from Dominica Single Father Poverty Correlation Chart
The statistical analysis conducted on geographies consisting of 82,675,302 people shows a poor positive correlation between the proportion of U.S. Virgin Islanders and poverty level among single fathers in the United States with a correlation coefficient (R) of 0.123 and weighted average of 18.1%. Similarly, the statistical analysis conducted on geographies consisting of 78,251,177 people shows a strong positive correlation between the proportion of Immigrants from Dominica and poverty level among single fathers in the United States with a correlation coefficient (R) of 0.753 and weighted average of 18.9%, a difference of 4.1%.
Single Father Poverty Correlation Summary
| Measurement | U.S. Virgin Islander | Immigrants from Dominica |
| Minimum | 0.75% | 9.4% |
| Maximum | 60.0% | 100.0% |
| Range | 59.2% | 90.6% |
| Mean | 21.5% | 30.2% |
| Median | 19.0% | 20.5% |
| Interquartile 25% (IQ1) | 13.1% | 16.4% |
| Interquartile 75% (IQ3) | 26.9% | 36.1% |
| Interquartile Range (IQR) | 13.8% | 19.7% |
| Standard Deviation (Sample) | 13.1% | 23.3% |
| Standard Deviation (Population) | 12.9% | 22.9% |
Demographics Similar to U.S. Virgin Islanders and Immigrants from Dominica by Single Father Poverty
In terms of single father poverty, the demographic groups most similar to U.S. Virgin Islanders are Alaska Native (18.1%, a difference of 0.030%), Yakama (18.1%, a difference of 0.060%), Seminole (18.1%, a difference of 0.17%), French (18.2%, a difference of 0.37%), and African (18.3%, a difference of 1.1%). Similarly, the demographic groups most similar to Immigrants from Dominica are Nonimmigrants (18.8%, a difference of 0.050%), Potawatomi (18.9%, a difference of 0.20%), Chippewa (18.8%, a difference of 0.24%), Immigrants from Micronesia (18.6%, a difference of 1.4%), and Ottawa (18.6%, a difference of 1.5%).
| Demographics | Rating | Rank | Single Father Poverty |
| Alaska Natives | 0.0 /100 | #293 | Tragic 18.1% |
| U.S. Virgin Islanders | 0.0 /100 | #294 | Tragic 18.1% |
| Yakama | 0.0 /100 | #295 | Tragic 18.1% |
| Seminole | 0.0 /100 | #296 | Tragic 18.1% |
| French | 0.0 /100 | #297 | Tragic 18.2% |
| Africans | 0.0 /100 | #298 | Tragic 18.3% |
| Whites/Caucasians | 0.0 /100 | #299 | Tragic 18.4% |
| Immigrants | Dominican Republic | 0.0 /100 | #300 | Tragic 18.4% |
| Hungarians | 0.0 /100 | #301 | Tragic 18.5% |
| Comanche | 0.0 /100 | #302 | Tragic 18.5% |
| Celtics | 0.0 /100 | #303 | Tragic 18.5% |
| Ute | 0.0 /100 | #304 | Tragic 18.5% |
| Blackfeet | 0.0 /100 | #305 | Tragic 18.5% |
| Scotch-Irish | 0.0 /100 | #306 | Tragic 18.6% |
| French Canadians | 0.0 /100 | #307 | Tragic 18.6% |
| Ottawa | 0.0 /100 | #308 | Tragic 18.6% |
| Immigrants | Micronesia | 0.0 /100 | #309 | Tragic 18.6% |
| Chippewa | 0.0 /100 | #310 | Tragic 18.8% |
| Immigrants | Nonimmigrants | 0.0 /100 | #311 | Tragic 18.8% |
| Immigrants | Dominica | 0.0 /100 | #312 | Tragic 18.9% |
| Potawatomi | 0.0 /100 | #313 | Tragic 18.9% |