U.S. Virgin Islander vs Subsaharan African Single Father Poverty
COMPARE
U.S. Virgin Islander
Subsaharan African
Single Father Poverty
Single Father Poverty Comparison
U.S. Virgin Islanders
Sub-Saharan Africans
18.1%
SINGLE FATHER POVERTY
0.0/ 100
METRIC RATING
294th/ 347
METRIC RANK
16.9%
SINGLE FATHER POVERTY
2.9/ 100
METRIC RATING
237th/ 347
METRIC RANK
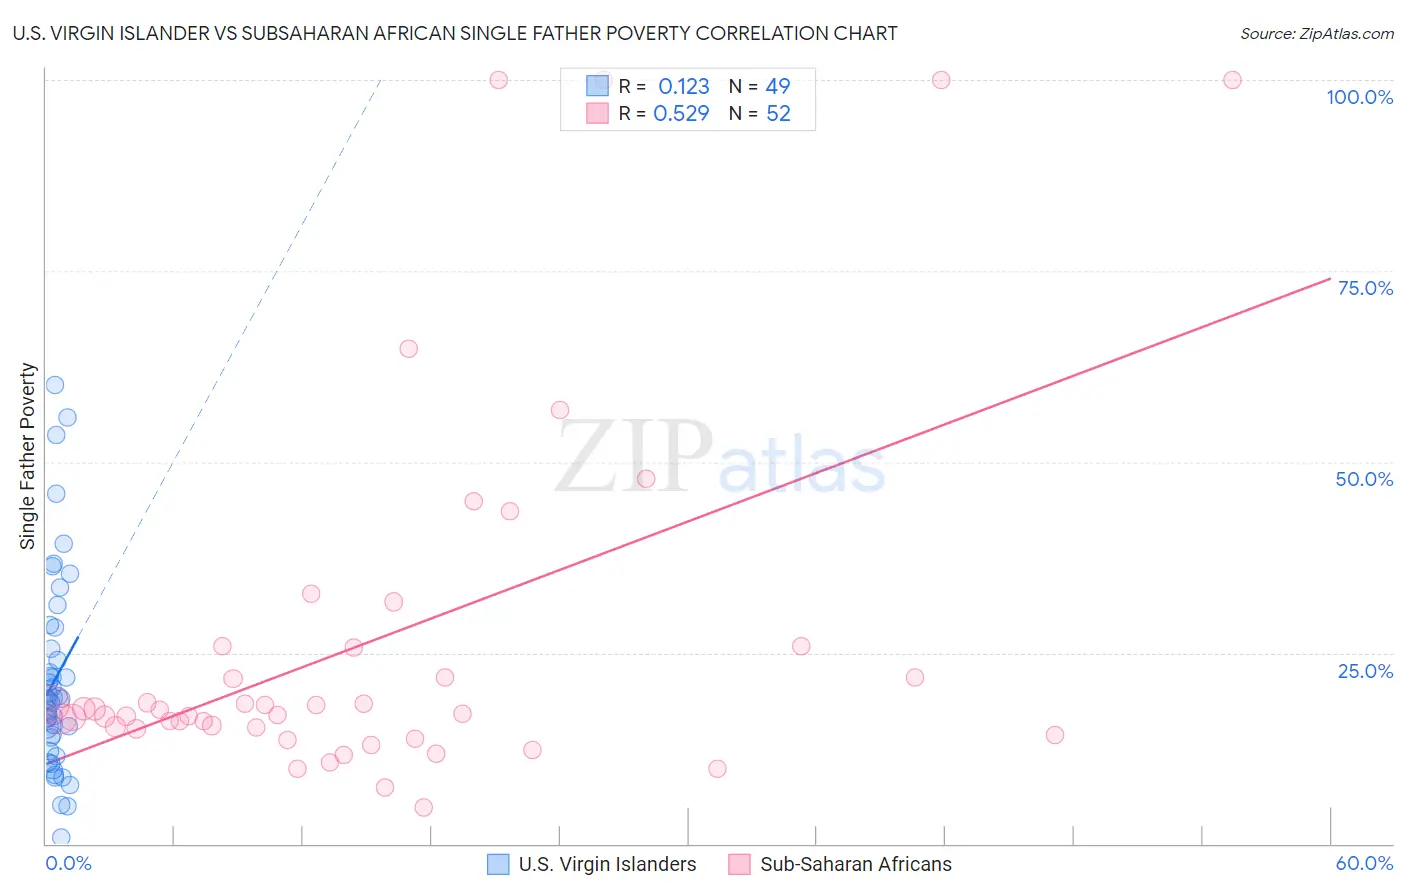
U.S. Virgin Islander vs Subsaharan African Single Father Poverty Correlation Chart
The statistical analysis conducted on geographies consisting of 82,675,302 people shows a poor positive correlation between the proportion of U.S. Virgin Islanders and poverty level among single fathers in the United States with a correlation coefficient (R) of 0.123 and weighted average of 18.1%. Similarly, the statistical analysis conducted on geographies consisting of 386,638,837 people shows a substantial positive correlation between the proportion of Sub-Saharan Africans and poverty level among single fathers in the United States with a correlation coefficient (R) of 0.529 and weighted average of 16.9%, a difference of 7.0%.
Single Father Poverty Correlation Summary
| Measurement | U.S. Virgin Islander | Subsaharan African |
| Minimum | 0.75% | 4.8% |
| Maximum | 60.0% | 100.0% |
| Range | 59.2% | 95.2% |
| Mean | 21.5% | 26.7% |
| Median | 19.0% | 17.3% |
| Interquartile 25% (IQ1) | 13.1% | 15.1% |
| Interquartile 75% (IQ3) | 26.9% | 25.8% |
| Interquartile Range (IQR) | 13.8% | 10.6% |
| Standard Deviation (Sample) | 13.1% | 24.4% |
| Standard Deviation (Population) | 12.9% | 24.1% |
Similar Demographics by Single Father Poverty
Demographics Similar to U.S. Virgin Islanders by Single Father Poverty
In terms of single father poverty, the demographic groups most similar to U.S. Virgin Islanders are Alaska Native (18.1%, a difference of 0.030%), Yakama (18.1%, a difference of 0.060%), Immigrants from Bahamas (18.1%, a difference of 0.13%), Alaskan Athabascan (18.1%, a difference of 0.14%), and Seminole (18.1%, a difference of 0.17%).
| Demographics | Rating | Rank | Single Father Poverty |
| Carpatho Rusyns | 0.0 /100 | #287 | Tragic 18.0% |
| Bahamians | 0.0 /100 | #288 | Tragic 18.0% |
| Irish | 0.0 /100 | #289 | Tragic 18.0% |
| West Indians | 0.0 /100 | #290 | Tragic 18.0% |
| Alaskan Athabascans | 0.0 /100 | #291 | Tragic 18.1% |
| Immigrants | Bahamas | 0.0 /100 | #292 | Tragic 18.1% |
| Alaska Natives | 0.0 /100 | #293 | Tragic 18.1% |
| U.S. Virgin Islanders | 0.0 /100 | #294 | Tragic 18.1% |
| Yakama | 0.0 /100 | #295 | Tragic 18.1% |
| Seminole | 0.0 /100 | #296 | Tragic 18.1% |
| French | 0.0 /100 | #297 | Tragic 18.2% |
| Africans | 0.0 /100 | #298 | Tragic 18.3% |
| Whites/Caucasians | 0.0 /100 | #299 | Tragic 18.4% |
| Immigrants | Dominican Republic | 0.0 /100 | #300 | Tragic 18.4% |
| Hungarians | 0.0 /100 | #301 | Tragic 18.5% |
Demographics Similar to Sub-Saharan Africans by Single Father Poverty
In terms of single father poverty, the demographic groups most similar to Sub-Saharan Africans are Immigrants from Western Europe (16.9%, a difference of 0.0%), Immigrants from Germany (16.9%, a difference of 0.0%), Immigrants from Saudi Arabia (16.9%, a difference of 0.070%), Bermudan (16.9%, a difference of 0.090%), and Marshallese (16.9%, a difference of 0.10%).
| Demographics | Rating | Rank | Single Father Poverty |
| Immigrants | Trinidad and Tobago | 4.5 /100 | #230 | Tragic 16.8% |
| Spanish Americans | 3.7 /100 | #231 | Tragic 16.9% |
| Immigrants | Grenada | 3.7 /100 | #232 | Tragic 16.9% |
| Senegalese | 3.2 /100 | #233 | Tragic 16.9% |
| Marshallese | 3.1 /100 | #234 | Tragic 16.9% |
| Immigrants | Western Europe | 2.9 /100 | #235 | Tragic 16.9% |
| Immigrants | Germany | 2.9 /100 | #236 | Tragic 16.9% |
| Sub-Saharan Africans | 2.9 /100 | #237 | Tragic 16.9% |
| Immigrants | Saudi Arabia | 2.7 /100 | #238 | Tragic 16.9% |
| Bermudans | 2.6 /100 | #239 | Tragic 16.9% |
| Finns | 2.6 /100 | #240 | Tragic 16.9% |
| Czechs | 2.3 /100 | #241 | Tragic 17.0% |
| Moroccans | 2.1 /100 | #242 | Tragic 17.0% |
| Immigrants | Cabo Verde | 1.6 /100 | #243 | Tragic 17.0% |
| Hondurans | 1.6 /100 | #244 | Tragic 17.0% |