Turkish vs Yuman Receiving Food Stamps
COMPARE
Turkish
Yuman
Receiving Food Stamps
Receiving Food Stamps Comparison
Turks
Yuman
9.5%
RECEIVING FOOD STAMPS
99.6/ 100
METRIC RATING
34th/ 347
METRIC RANK
20.2%
RECEIVING FOOD STAMPS
0.0/ 100
METRIC RATING
334th/ 347
METRIC RANK
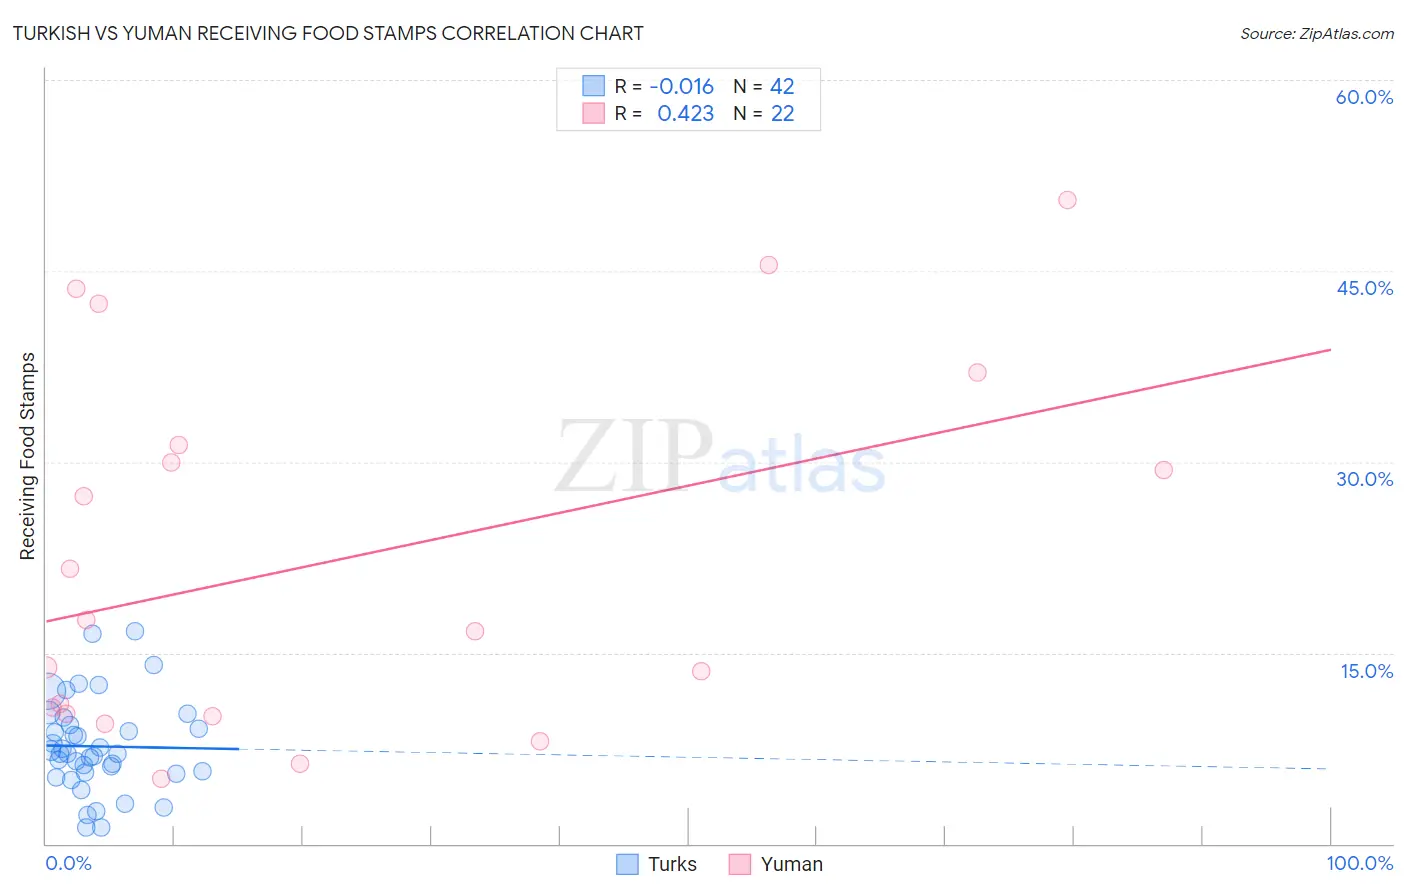
Turkish vs Yuman Receiving Food Stamps Correlation Chart
The statistical analysis conducted on geographies consisting of 271,161,413 people shows no correlation between the proportion of Turks and percentage of population receiving government assistance and/or food stamps in the United States with a correlation coefficient (R) of -0.016 and weighted average of 9.5%. Similarly, the statistical analysis conducted on geographies consisting of 40,663,437 people shows a moderate positive correlation between the proportion of Yuman and percentage of population receiving government assistance and/or food stamps in the United States with a correlation coefficient (R) of 0.423 and weighted average of 20.2%, a difference of 113.3%.
Receiving Food Stamps Correlation Summary
| Measurement | Turkish | Yuman |
| Minimum | 1.2% | 5.1% |
| Maximum | 16.7% | 50.6% |
| Range | 15.5% | 45.5% |
| Mean | 7.6% | 22.3% |
| Median | 7.1% | 17.1% |
| Interquartile 25% (IQ1) | 5.6% | 10.2% |
| Interquartile 75% (IQ3) | 9.3% | 31.3% |
| Interquartile Range (IQR) | 3.7% | 21.1% |
| Standard Deviation (Sample) | 3.6% | 14.3% |
| Standard Deviation (Population) | 3.6% | 14.0% |
Similar Demographics by Receiving Food Stamps
Demographics Similar to Turks by Receiving Food Stamps
In terms of receiving food stamps, the demographic groups most similar to Turks are Zimbabwean (9.5%, a difference of 0.010%), Immigrants from Austria (9.5%, a difference of 0.030%), Estonian (9.5%, a difference of 0.050%), European (9.5%, a difference of 0.12%), and Immigrants from Sri Lanka (9.5%, a difference of 0.41%).
| Demographics | Rating | Rank | Receiving Food Stamps |
| Bhutanese | 99.8 /100 | #27 | Exceptional 9.2% |
| Czechs | 99.8 /100 | #28 | Exceptional 9.2% |
| Immigrants | Lithuania | 99.8 /100 | #29 | Exceptional 9.2% |
| Immigrants | Sweden | 99.7 /100 | #30 | Exceptional 9.3% |
| Immigrants | Eastern Asia | 99.7 /100 | #31 | Exceptional 9.3% |
| Bolivians | 99.7 /100 | #32 | Exceptional 9.3% |
| Zimbabweans | 99.6 /100 | #33 | Exceptional 9.5% |
| Turks | 99.6 /100 | #34 | Exceptional 9.5% |
| Immigrants | Austria | 99.6 /100 | #35 | Exceptional 9.5% |
| Estonians | 99.6 /100 | #36 | Exceptional 9.5% |
| Europeans | 99.6 /100 | #37 | Exceptional 9.5% |
| Immigrants | Sri Lanka | 99.5 /100 | #38 | Exceptional 9.5% |
| Immigrants | Bolivia | 99.5 /100 | #39 | Exceptional 9.5% |
| Immigrants | Netherlands | 99.5 /100 | #40 | Exceptional 9.5% |
| Cambodians | 99.5 /100 | #41 | Exceptional 9.5% |
Demographics Similar to Yuman by Receiving Food Stamps
In terms of receiving food stamps, the demographic groups most similar to Yuman are Inupiat (20.1%, a difference of 0.86%), Pueblo (19.9%, a difference of 1.6%), Immigrants from Cuba (20.8%, a difference of 2.9%), Immigrants from Caribbean (19.6%, a difference of 3.1%), and Navajo (21.1%, a difference of 4.1%).
| Demographics | Rating | Rank | Receiving Food Stamps |
| Apache | 0.0 /100 | #327 | Tragic 18.3% |
| Colville | 0.0 /100 | #328 | Tragic 18.3% |
| Immigrants | Dominica | 0.0 /100 | #329 | Tragic 18.4% |
| Pima | 0.0 /100 | #330 | Tragic 19.0% |
| Immigrants | Caribbean | 0.0 /100 | #331 | Tragic 19.6% |
| Pueblo | 0.0 /100 | #332 | Tragic 19.9% |
| Inupiat | 0.0 /100 | #333 | Tragic 20.1% |
| Yuman | 0.0 /100 | #334 | Tragic 20.2% |
| Immigrants | Cuba | 0.0 /100 | #335 | Tragic 20.8% |
| Navajo | 0.0 /100 | #336 | Tragic 21.1% |
| Cape Verdeans | 0.0 /100 | #337 | Tragic 21.1% |
| Dominicans | 0.0 /100 | #338 | Tragic 21.4% |
| Yakama | 0.0 /100 | #339 | Tragic 21.4% |
| Tohono O'odham | 0.0 /100 | #340 | Tragic 21.5% |
| Hopi | 0.0 /100 | #341 | Tragic 21.6% |