Immigrants from Somalia vs Yuman Receiving Food Stamps
COMPARE
Immigrants from Somalia
Yuman
Receiving Food Stamps
Receiving Food Stamps Comparison
Immigrants from Somalia
Yuman
13.7%
RECEIVING FOOD STAMPS
0.9/ 100
METRIC RATING
245th/ 347
METRIC RANK
20.2%
RECEIVING FOOD STAMPS
0.0/ 100
METRIC RATING
334th/ 347
METRIC RANK
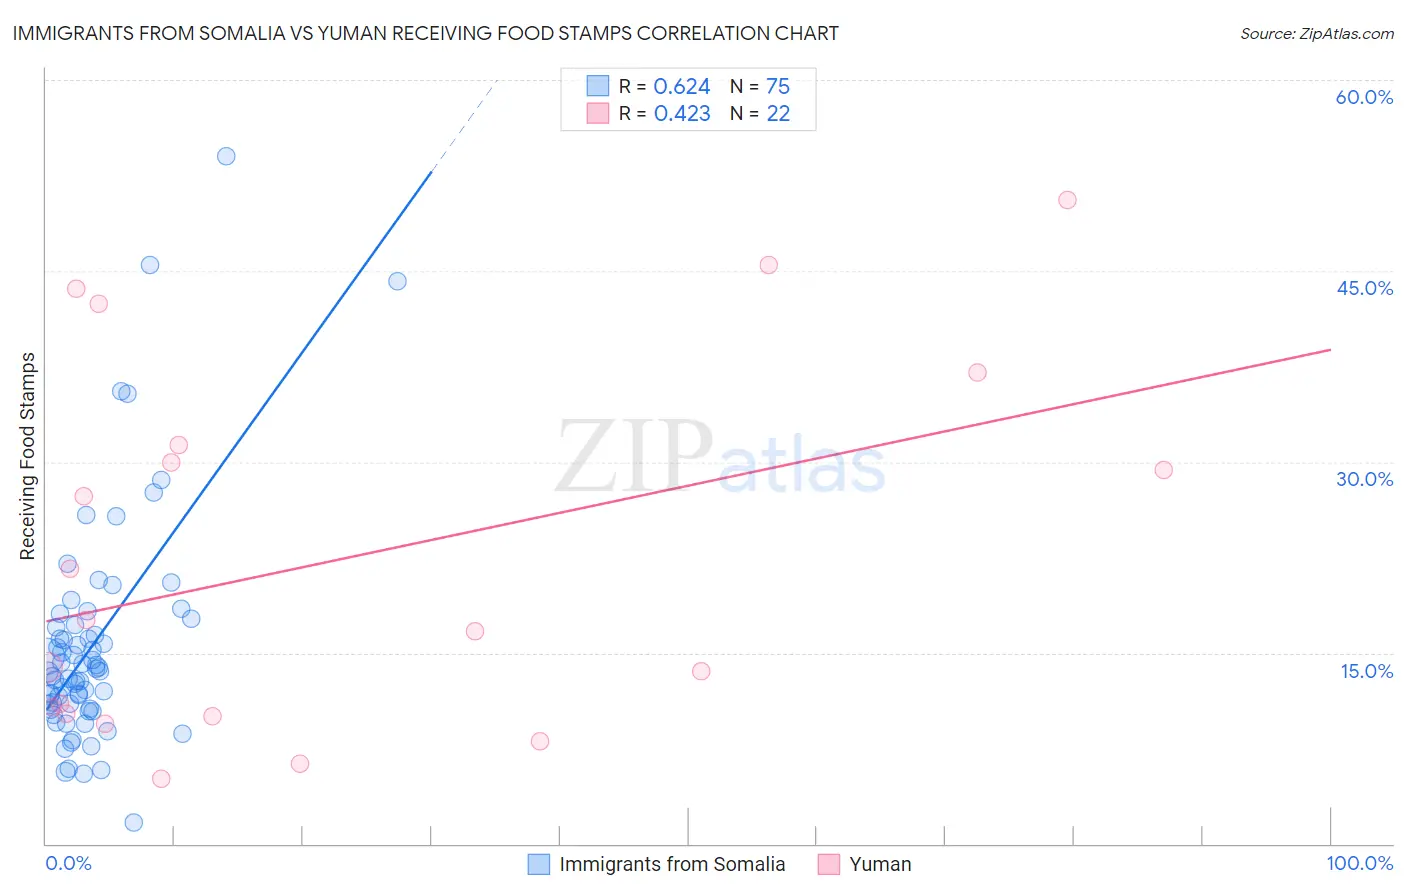
Immigrants from Somalia vs Yuman Receiving Food Stamps Correlation Chart
The statistical analysis conducted on geographies consisting of 92,085,024 people shows a significant positive correlation between the proportion of Immigrants from Somalia and percentage of population receiving government assistance and/or food stamps in the United States with a correlation coefficient (R) of 0.624 and weighted average of 13.7%. Similarly, the statistical analysis conducted on geographies consisting of 40,663,437 people shows a moderate positive correlation between the proportion of Yuman and percentage of population receiving government assistance and/or food stamps in the United States with a correlation coefficient (R) of 0.423 and weighted average of 20.2%, a difference of 47.8%.
Receiving Food Stamps Correlation Summary
| Measurement | Immigrants from Somalia | Yuman |
| Minimum | 1.7% | 5.1% |
| Maximum | 54.0% | 50.6% |
| Range | 52.3% | 45.5% |
| Mean | 15.6% | 22.3% |
| Median | 13.6% | 17.1% |
| Interquartile 25% (IQ1) | 10.6% | 10.2% |
| Interquartile 75% (IQ3) | 17.2% | 31.3% |
| Interquartile Range (IQR) | 6.6% | 21.1% |
| Standard Deviation (Sample) | 9.1% | 14.3% |
| Standard Deviation (Population) | 9.0% | 14.0% |
Similar Demographics by Receiving Food Stamps
Demographics Similar to Immigrants from Somalia by Receiving Food Stamps
In terms of receiving food stamps, the demographic groups most similar to Immigrants from Somalia are Cajun (13.7%, a difference of 0.040%), Somali (13.7%, a difference of 0.20%), Cree (13.7%, a difference of 0.24%), Immigrants from Panama (13.6%, a difference of 0.39%), and Mexican American Indian (13.8%, a difference of 0.51%).
| Demographics | Rating | Rank | Receiving Food Stamps |
| French American Indians | 1.4 /100 | #238 | Tragic 13.5% |
| Immigrants | Micronesia | 1.3 /100 | #239 | Tragic 13.5% |
| Iroquois | 1.2 /100 | #240 | Tragic 13.5% |
| Choctaw | 1.0 /100 | #241 | Tragic 13.6% |
| Immigrants | Panama | 1.0 /100 | #242 | Tragic 13.6% |
| Somalis | 0.9 /100 | #243 | Tragic 13.7% |
| Cajuns | 0.9 /100 | #244 | Tragic 13.7% |
| Immigrants | Somalia | 0.9 /100 | #245 | Tragic 13.7% |
| Cree | 0.8 /100 | #246 | Tragic 13.7% |
| Mexican American Indians | 0.7 /100 | #247 | Tragic 13.8% |
| Immigrants | Laos | 0.7 /100 | #248 | Tragic 13.8% |
| Indonesians | 0.6 /100 | #249 | Tragic 13.9% |
| Immigrants | Cambodia | 0.5 /100 | #250 | Tragic 13.9% |
| Yaqui | 0.5 /100 | #251 | Tragic 13.9% |
| Ghanaians | 0.5 /100 | #252 | Tragic 14.0% |
Demographics Similar to Yuman by Receiving Food Stamps
In terms of receiving food stamps, the demographic groups most similar to Yuman are Inupiat (20.1%, a difference of 0.86%), Pueblo (19.9%, a difference of 1.6%), Immigrants from Cuba (20.8%, a difference of 2.9%), Immigrants from Caribbean (19.6%, a difference of 3.1%), and Navajo (21.1%, a difference of 4.1%).
| Demographics | Rating | Rank | Receiving Food Stamps |
| Apache | 0.0 /100 | #327 | Tragic 18.3% |
| Colville | 0.0 /100 | #328 | Tragic 18.3% |
| Immigrants | Dominica | 0.0 /100 | #329 | Tragic 18.4% |
| Pima | 0.0 /100 | #330 | Tragic 19.0% |
| Immigrants | Caribbean | 0.0 /100 | #331 | Tragic 19.6% |
| Pueblo | 0.0 /100 | #332 | Tragic 19.9% |
| Inupiat | 0.0 /100 | #333 | Tragic 20.1% |
| Yuman | 0.0 /100 | #334 | Tragic 20.2% |
| Immigrants | Cuba | 0.0 /100 | #335 | Tragic 20.8% |
| Navajo | 0.0 /100 | #336 | Tragic 21.1% |
| Cape Verdeans | 0.0 /100 | #337 | Tragic 21.1% |
| Dominicans | 0.0 /100 | #338 | Tragic 21.4% |
| Yakama | 0.0 /100 | #339 | Tragic 21.4% |
| Tohono O'odham | 0.0 /100 | #340 | Tragic 21.5% |
| Hopi | 0.0 /100 | #341 | Tragic 21.6% |