Turkish vs Korean Receiving Food Stamps
COMPARE
Turkish
Korean
Receiving Food Stamps
Receiving Food Stamps Comparison
Turks
Koreans
9.5%
RECEIVING FOOD STAMPS
99.6/ 100
METRIC RATING
34th/ 347
METRIC RANK
10.4%
RECEIVING FOOD STAMPS
96.3/ 100
METRIC RATING
107th/ 347
METRIC RANK
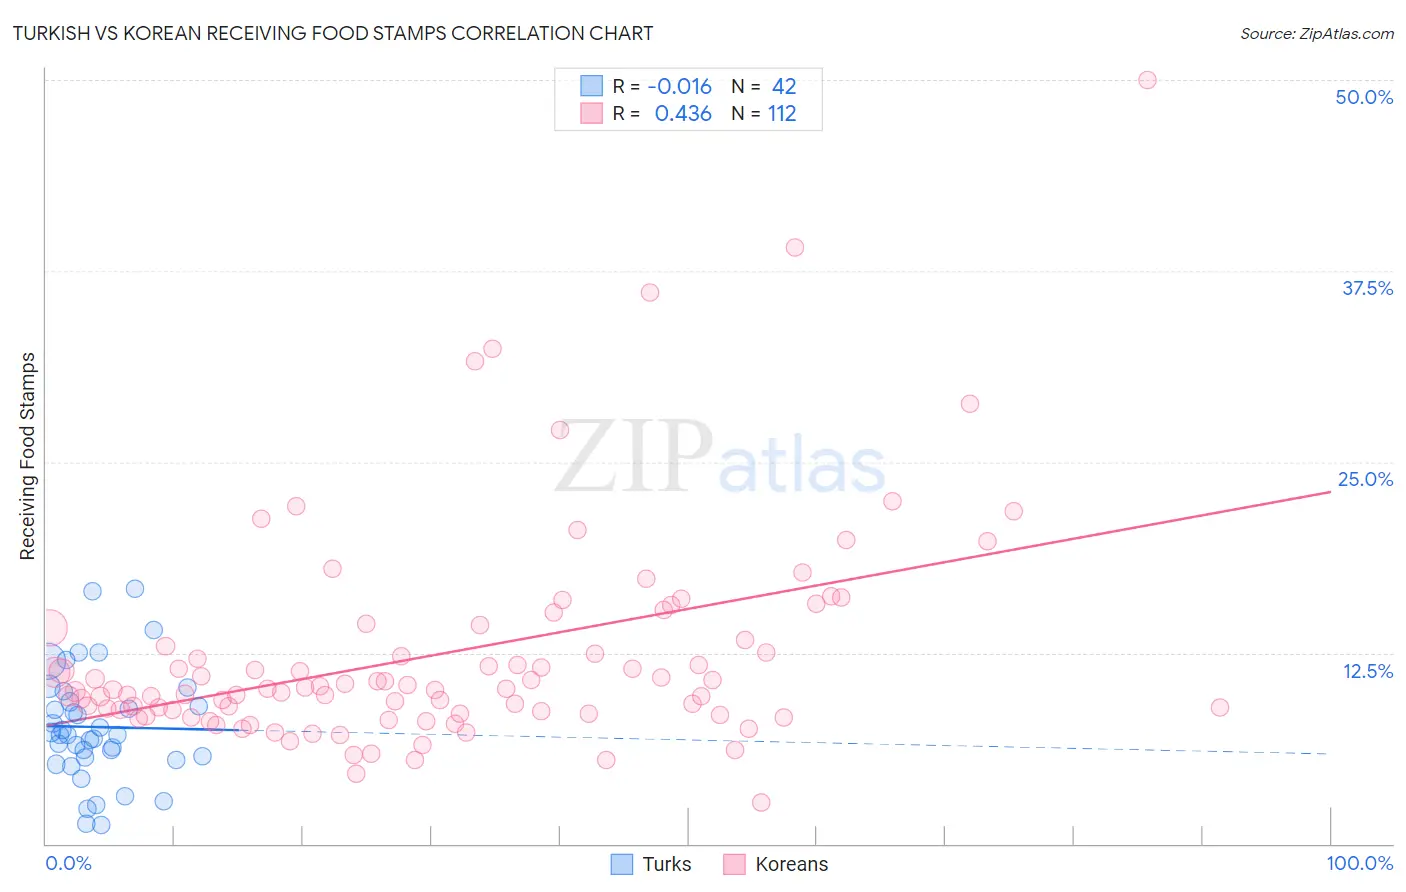
Turkish vs Korean Receiving Food Stamps Correlation Chart
The statistical analysis conducted on geographies consisting of 271,161,413 people shows no correlation between the proportion of Turks and percentage of population receiving government assistance and/or food stamps in the United States with a correlation coefficient (R) of -0.016 and weighted average of 9.5%. Similarly, the statistical analysis conducted on geographies consisting of 508,812,505 people shows a moderate positive correlation between the proportion of Koreans and percentage of population receiving government assistance and/or food stamps in the United States with a correlation coefficient (R) of 0.436 and weighted average of 10.4%, a difference of 9.7%.
Receiving Food Stamps Correlation Summary
| Measurement | Turkish | Korean |
| Minimum | 1.2% | 2.7% |
| Maximum | 16.7% | 50.0% |
| Range | 15.5% | 47.3% |
| Mean | 7.6% | 12.5% |
| Median | 7.1% | 10.1% |
| Interquartile 25% (IQ1) | 5.6% | 8.6% |
| Interquartile 75% (IQ3) | 9.3% | 13.7% |
| Interquartile Range (IQR) | 3.7% | 5.1% |
| Standard Deviation (Sample) | 3.6% | 7.2% |
| Standard Deviation (Population) | 3.6% | 7.2% |
Similar Demographics by Receiving Food Stamps
Demographics Similar to Turks by Receiving Food Stamps
In terms of receiving food stamps, the demographic groups most similar to Turks are Zimbabwean (9.5%, a difference of 0.010%), Immigrants from Austria (9.5%, a difference of 0.030%), Estonian (9.5%, a difference of 0.050%), European (9.5%, a difference of 0.12%), and Immigrants from Sri Lanka (9.5%, a difference of 0.41%).
| Demographics | Rating | Rank | Receiving Food Stamps |
| Bhutanese | 99.8 /100 | #27 | Exceptional 9.2% |
| Czechs | 99.8 /100 | #28 | Exceptional 9.2% |
| Immigrants | Lithuania | 99.8 /100 | #29 | Exceptional 9.2% |
| Immigrants | Sweden | 99.7 /100 | #30 | Exceptional 9.3% |
| Immigrants | Eastern Asia | 99.7 /100 | #31 | Exceptional 9.3% |
| Bolivians | 99.7 /100 | #32 | Exceptional 9.3% |
| Zimbabweans | 99.6 /100 | #33 | Exceptional 9.5% |
| Turks | 99.6 /100 | #34 | Exceptional 9.5% |
| Immigrants | Austria | 99.6 /100 | #35 | Exceptional 9.5% |
| Estonians | 99.6 /100 | #36 | Exceptional 9.5% |
| Europeans | 99.6 /100 | #37 | Exceptional 9.5% |
| Immigrants | Sri Lanka | 99.5 /100 | #38 | Exceptional 9.5% |
| Immigrants | Bolivia | 99.5 /100 | #39 | Exceptional 9.5% |
| Immigrants | Netherlands | 99.5 /100 | #40 | Exceptional 9.5% |
| Cambodians | 99.5 /100 | #41 | Exceptional 9.5% |
Demographics Similar to Koreans by Receiving Food Stamps
In terms of receiving food stamps, the demographic groups most similar to Koreans are Carpatho Rusyn (10.4%, a difference of 0.030%), Immigrants from Pakistan (10.4%, a difference of 0.080%), Immigrants from Italy (10.4%, a difference of 0.15%), Immigrants from Malaysia (10.4%, a difference of 0.24%), and Pakistani (10.4%, a difference of 0.36%).
| Demographics | Rating | Rank | Receiving Food Stamps |
| Immigrants | Western Europe | 96.9 /100 | #100 | Exceptional 10.3% |
| Palestinians | 96.9 /100 | #101 | Exceptional 10.3% |
| Immigrants | Europe | 96.8 /100 | #102 | Exceptional 10.3% |
| Immigrants | Latvia | 96.8 /100 | #103 | Exceptional 10.3% |
| Immigrants | Hungary | 96.7 /100 | #104 | Exceptional 10.3% |
| Immigrants | Malaysia | 96.5 /100 | #105 | Exceptional 10.4% |
| Immigrants | Italy | 96.4 /100 | #106 | Exceptional 10.4% |
| Koreans | 96.3 /100 | #107 | Exceptional 10.4% |
| Carpatho Rusyns | 96.2 /100 | #108 | Exceptional 10.4% |
| Immigrants | Pakistan | 96.2 /100 | #109 | Exceptional 10.4% |
| Pakistanis | 95.9 /100 | #110 | Exceptional 10.4% |
| Romanians | 95.8 /100 | #111 | Exceptional 10.4% |
| Mongolians | 95.8 /100 | #112 | Exceptional 10.5% |
| Icelanders | 95.4 /100 | #113 | Exceptional 10.5% |
| Scotch-Irish | 95.1 /100 | #114 | Exceptional 10.5% |