Turkish vs Immigrants from Jamaica Receiving Food Stamps
COMPARE
Turkish
Immigrants from Jamaica
Receiving Food Stamps
Receiving Food Stamps Comparison
Turks
Immigrants from Jamaica
9.5%
RECEIVING FOOD STAMPS
99.6/ 100
METRIC RATING
34th/ 347
METRIC RANK
16.9%
RECEIVING FOOD STAMPS
0.0/ 100
METRIC RATING
313th/ 347
METRIC RANK
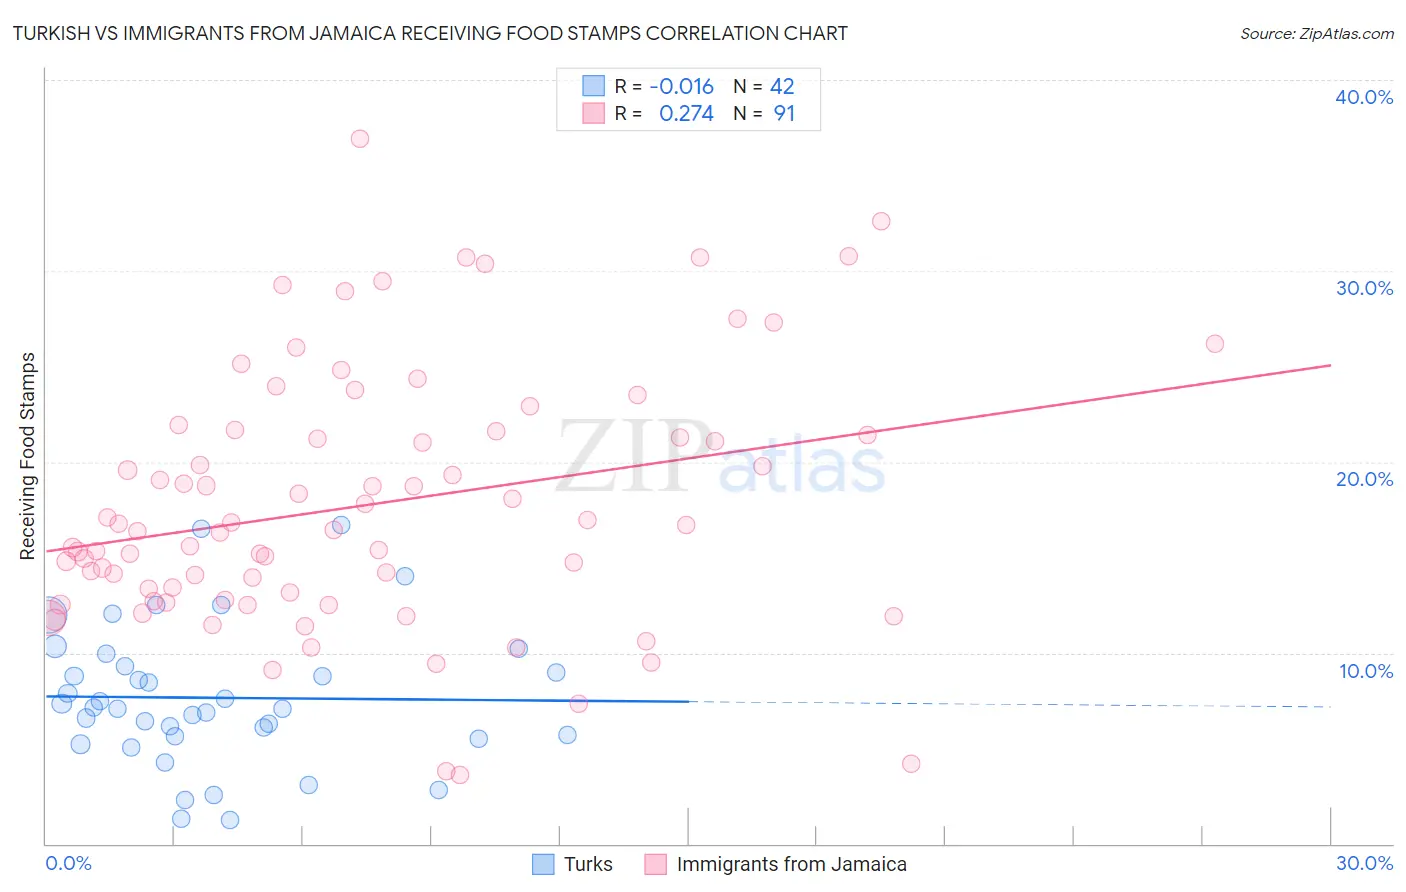
Turkish vs Immigrants from Jamaica Receiving Food Stamps Correlation Chart
The statistical analysis conducted on geographies consisting of 271,161,413 people shows no correlation between the proportion of Turks and percentage of population receiving government assistance and/or food stamps in the United States with a correlation coefficient (R) of -0.016 and weighted average of 9.5%. Similarly, the statistical analysis conducted on geographies consisting of 301,234,933 people shows a weak positive correlation between the proportion of Immigrants from Jamaica and percentage of population receiving government assistance and/or food stamps in the United States with a correlation coefficient (R) of 0.274 and weighted average of 16.9%, a difference of 78.0%.
Receiving Food Stamps Correlation Summary
| Measurement | Turkish | Immigrants from Jamaica |
| Minimum | 1.2% | 3.6% |
| Maximum | 16.7% | 36.9% |
| Range | 15.5% | 33.3% |
| Mean | 7.6% | 17.7% |
| Median | 7.1% | 16.4% |
| Interquartile 25% (IQ1) | 5.6% | 12.8% |
| Interquartile 75% (IQ3) | 9.3% | 21.6% |
| Interquartile Range (IQR) | 3.7% | 8.8% |
| Standard Deviation (Sample) | 3.6% | 6.7% |
| Standard Deviation (Population) | 3.6% | 6.7% |
Similar Demographics by Receiving Food Stamps
Demographics Similar to Turks by Receiving Food Stamps
In terms of receiving food stamps, the demographic groups most similar to Turks are Zimbabwean (9.5%, a difference of 0.010%), Immigrants from Austria (9.5%, a difference of 0.030%), Estonian (9.5%, a difference of 0.050%), European (9.5%, a difference of 0.12%), and Immigrants from Sri Lanka (9.5%, a difference of 0.41%).
| Demographics | Rating | Rank | Receiving Food Stamps |
| Bhutanese | 99.8 /100 | #27 | Exceptional 9.2% |
| Czechs | 99.8 /100 | #28 | Exceptional 9.2% |
| Immigrants | Lithuania | 99.8 /100 | #29 | Exceptional 9.2% |
| Immigrants | Sweden | 99.7 /100 | #30 | Exceptional 9.3% |
| Immigrants | Eastern Asia | 99.7 /100 | #31 | Exceptional 9.3% |
| Bolivians | 99.7 /100 | #32 | Exceptional 9.3% |
| Zimbabweans | 99.6 /100 | #33 | Exceptional 9.5% |
| Turks | 99.6 /100 | #34 | Exceptional 9.5% |
| Immigrants | Austria | 99.6 /100 | #35 | Exceptional 9.5% |
| Estonians | 99.6 /100 | #36 | Exceptional 9.5% |
| Europeans | 99.6 /100 | #37 | Exceptional 9.5% |
| Immigrants | Sri Lanka | 99.5 /100 | #38 | Exceptional 9.5% |
| Immigrants | Bolivia | 99.5 /100 | #39 | Exceptional 9.5% |
| Immigrants | Netherlands | 99.5 /100 | #40 | Exceptional 9.5% |
| Cambodians | 99.5 /100 | #41 | Exceptional 9.5% |
Demographics Similar to Immigrants from Jamaica by Receiving Food Stamps
In terms of receiving food stamps, the demographic groups most similar to Immigrants from Jamaica are Immigrants from Guyana (16.9%, a difference of 0.17%), Sioux (16.8%, a difference of 0.28%), Bahamian (17.0%, a difference of 0.74%), Guyanese (16.7%, a difference of 0.98%), and Central American Indian (17.1%, a difference of 1.2%).
| Demographics | Rating | Rank | Receiving Food Stamps |
| Jamaicans | 0.0 /100 | #306 | Tragic 16.4% |
| Houma | 0.0 /100 | #307 | Tragic 16.5% |
| Barbadians | 0.0 /100 | #308 | Tragic 16.5% |
| U.S. Virgin Islanders | 0.0 /100 | #309 | Tragic 16.5% |
| Immigrants | Barbados | 0.0 /100 | #310 | Tragic 16.6% |
| Guyanese | 0.0 /100 | #311 | Tragic 16.7% |
| Sioux | 0.0 /100 | #312 | Tragic 16.8% |
| Immigrants | Jamaica | 0.0 /100 | #313 | Tragic 16.9% |
| Immigrants | Guyana | 0.0 /100 | #314 | Tragic 16.9% |
| Bahamians | 0.0 /100 | #315 | Tragic 17.0% |
| Central American Indians | 0.0 /100 | #316 | Tragic 17.1% |
| Blacks/African Americans | 0.0 /100 | #317 | Tragic 17.2% |
| Menominee | 0.0 /100 | #318 | Tragic 17.2% |
| Immigrants | St. Vincent and the Grenadines | 0.0 /100 | #319 | Tragic 17.2% |
| Immigrants | Nicaragua | 0.0 /100 | #320 | Tragic 17.2% |