Immigrants from Sudan vs Yuman Receiving Food Stamps
COMPARE
Immigrants from Sudan
Yuman
Receiving Food Stamps
Receiving Food Stamps Comparison
Immigrants from Sudan
Yuman
12.1%
RECEIVING FOOD STAMPS
27.1/ 100
METRIC RATING
194th/ 347
METRIC RANK
20.2%
RECEIVING FOOD STAMPS
0.0/ 100
METRIC RATING
334th/ 347
METRIC RANK
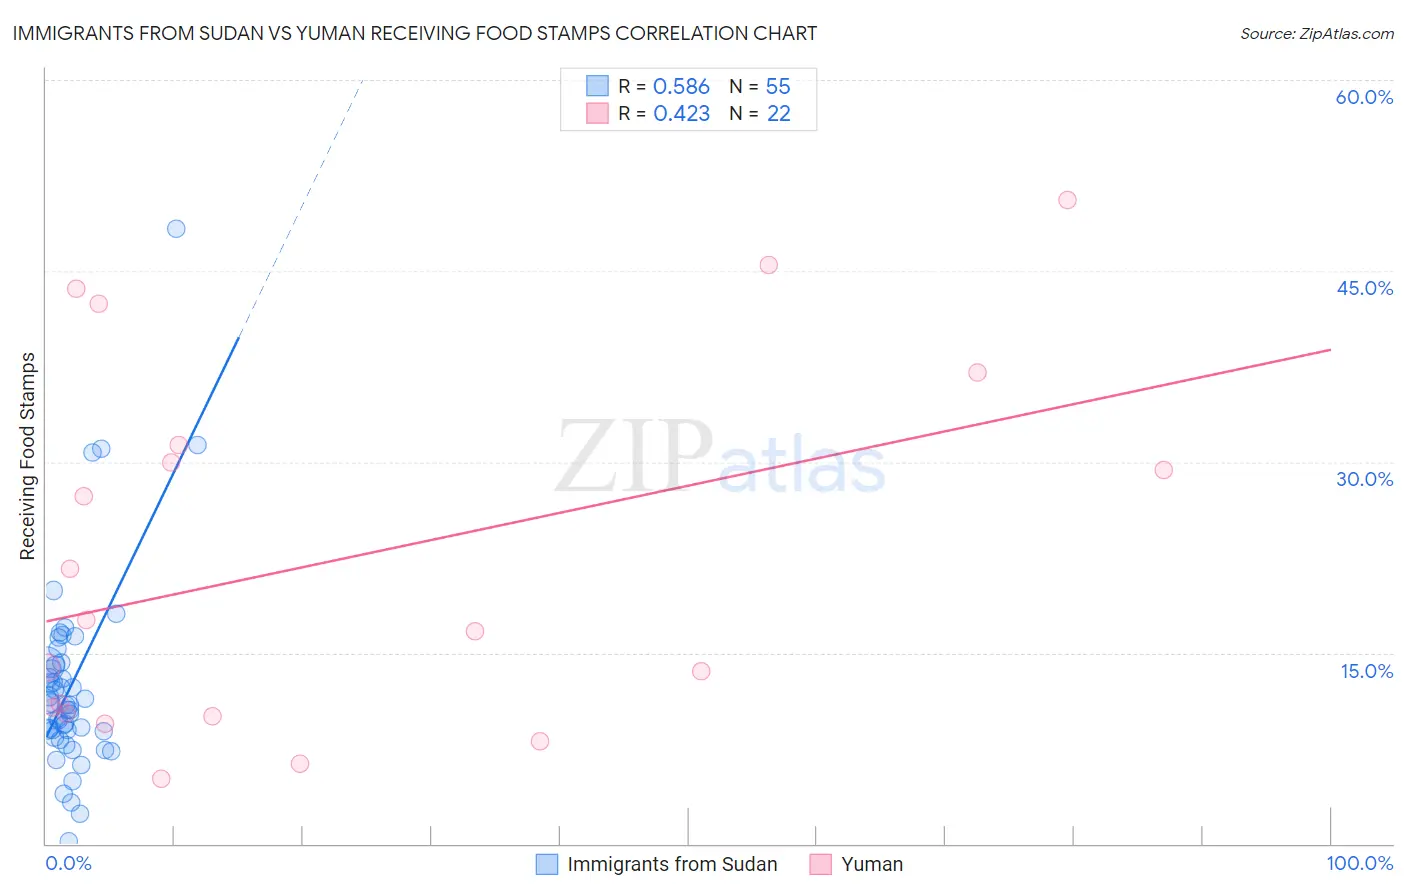
Immigrants from Sudan vs Yuman Receiving Food Stamps Correlation Chart
The statistical analysis conducted on geographies consisting of 118,933,467 people shows a substantial positive correlation between the proportion of Immigrants from Sudan and percentage of population receiving government assistance and/or food stamps in the United States with a correlation coefficient (R) of 0.586 and weighted average of 12.1%. Similarly, the statistical analysis conducted on geographies consisting of 40,663,437 people shows a moderate positive correlation between the proportion of Yuman and percentage of population receiving government assistance and/or food stamps in the United States with a correlation coefficient (R) of 0.423 and weighted average of 20.2%, a difference of 66.5%.
Receiving Food Stamps Correlation Summary
| Measurement | Immigrants from Sudan | Yuman |
| Minimum | 0.20% | 5.1% |
| Maximum | 48.3% | 50.6% |
| Range | 48.1% | 45.5% |
| Mean | 12.5% | 22.3% |
| Median | 10.9% | 17.1% |
| Interquartile 25% (IQ1) | 8.8% | 10.2% |
| Interquartile 75% (IQ3) | 14.1% | 31.3% |
| Interquartile Range (IQR) | 5.3% | 21.1% |
| Standard Deviation (Sample) | 7.8% | 14.3% |
| Standard Deviation (Population) | 7.8% | 14.0% |
Similar Demographics by Receiving Food Stamps
Demographics Similar to Immigrants from Sudan by Receiving Food Stamps
In terms of receiving food stamps, the demographic groups most similar to Immigrants from Sudan are American (12.2%, a difference of 0.060%), Iraqi (12.2%, a difference of 0.090%), Immigrants from Fiji (12.1%, a difference of 0.12%), Delaware (12.2%, a difference of 0.17%), and Immigrants from Costa Rica (12.2%, a difference of 0.30%).
| Demographics | Rating | Rank | Receiving Food Stamps |
| Albanians | 35.4 /100 | #187 | Fair 12.0% |
| Sudanese | 33.4 /100 | #188 | Fair 12.0% |
| Immigrants | Cameroon | 32.5 /100 | #189 | Fair 12.0% |
| Immigrants | Peru | 32.2 /100 | #190 | Fair 12.0% |
| Venezuelans | 32.1 /100 | #191 | Fair 12.0% |
| Samoans | 31.0 /100 | #192 | Fair 12.1% |
| Immigrants | Fiji | 27.8 /100 | #193 | Fair 12.1% |
| Immigrants | Sudan | 27.1 /100 | #194 | Fair 12.1% |
| Americans | 26.7 /100 | #195 | Fair 12.2% |
| Iraqis | 26.6 /100 | #196 | Fair 12.2% |
| Delaware | 26.1 /100 | #197 | Fair 12.2% |
| Immigrants | Costa Rica | 25.4 /100 | #198 | Fair 12.2% |
| Portuguese | 25.1 /100 | #199 | Fair 12.2% |
| Sierra Leoneans | 23.6 /100 | #200 | Fair 12.2% |
| Ugandans | 22.5 /100 | #201 | Fair 12.2% |
Demographics Similar to Yuman by Receiving Food Stamps
In terms of receiving food stamps, the demographic groups most similar to Yuman are Inupiat (20.1%, a difference of 0.86%), Pueblo (19.9%, a difference of 1.6%), Immigrants from Cuba (20.8%, a difference of 2.9%), Immigrants from Caribbean (19.6%, a difference of 3.1%), and Navajo (21.1%, a difference of 4.1%).
| Demographics | Rating | Rank | Receiving Food Stamps |
| Apache | 0.0 /100 | #327 | Tragic 18.3% |
| Colville | 0.0 /100 | #328 | Tragic 18.3% |
| Immigrants | Dominica | 0.0 /100 | #329 | Tragic 18.4% |
| Pima | 0.0 /100 | #330 | Tragic 19.0% |
| Immigrants | Caribbean | 0.0 /100 | #331 | Tragic 19.6% |
| Pueblo | 0.0 /100 | #332 | Tragic 19.9% |
| Inupiat | 0.0 /100 | #333 | Tragic 20.1% |
| Yuman | 0.0 /100 | #334 | Tragic 20.2% |
| Immigrants | Cuba | 0.0 /100 | #335 | Tragic 20.8% |
| Navajo | 0.0 /100 | #336 | Tragic 21.1% |
| Cape Verdeans | 0.0 /100 | #337 | Tragic 21.1% |
| Dominicans | 0.0 /100 | #338 | Tragic 21.4% |
| Yakama | 0.0 /100 | #339 | Tragic 21.4% |
| Tohono O'odham | 0.0 /100 | #340 | Tragic 21.5% |
| Hopi | 0.0 /100 | #341 | Tragic 21.6% |