Immigrants from Hong Kong vs Korean Receiving Food Stamps
COMPARE
Immigrants from Hong Kong
Korean
Receiving Food Stamps
Receiving Food Stamps Comparison
Immigrants from Hong Kong
Koreans
9.1%
RECEIVING FOOD STAMPS
99.8/ 100
METRIC RATING
19th/ 347
METRIC RANK
10.4%
RECEIVING FOOD STAMPS
96.3/ 100
METRIC RATING
107th/ 347
METRIC RANK
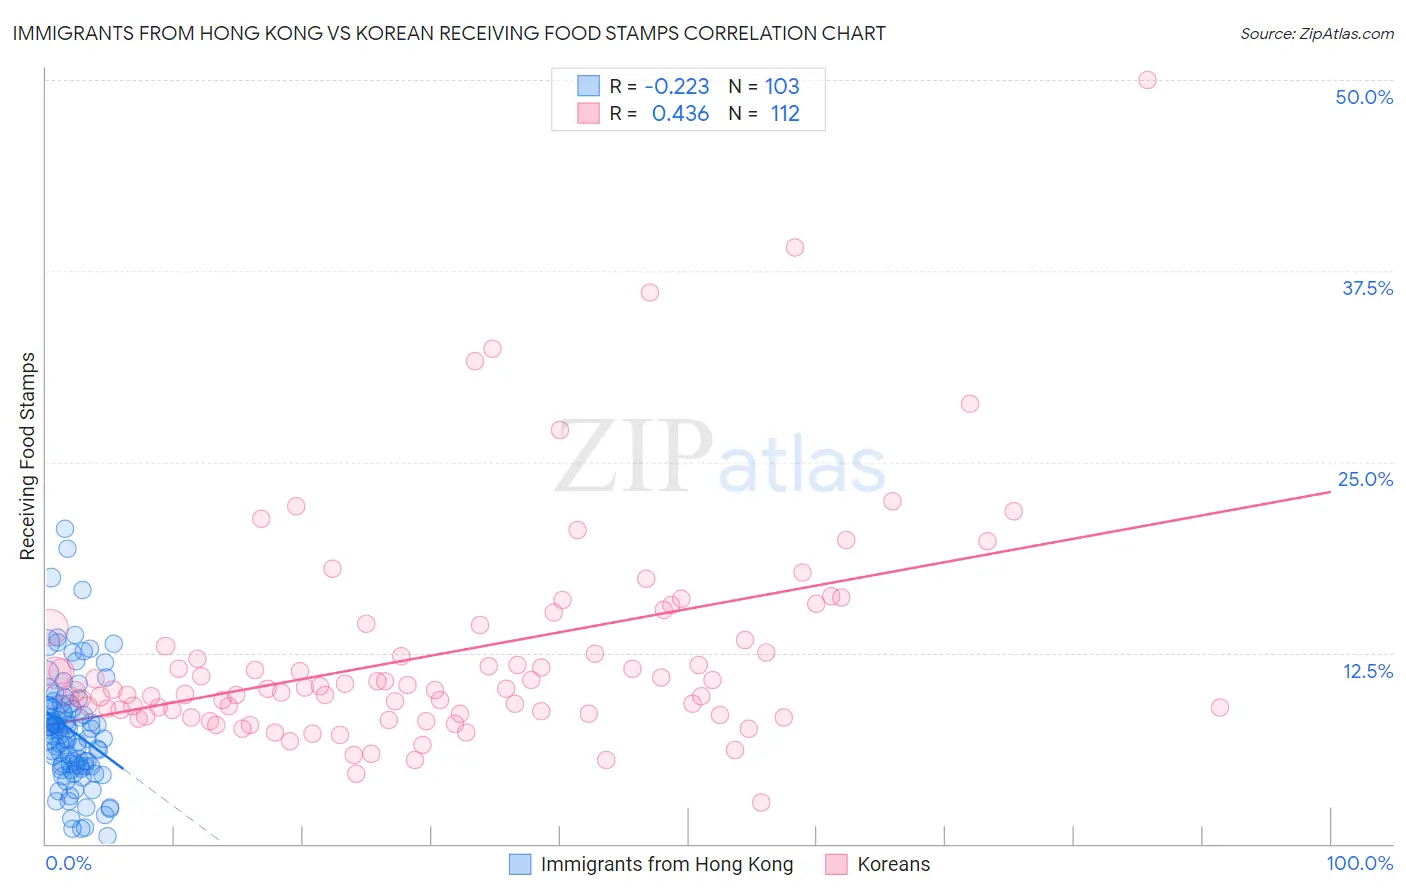
Immigrants from Hong Kong vs Korean Receiving Food Stamps Correlation Chart
The statistical analysis conducted on geographies consisting of 253,389,462 people shows a weak negative correlation between the proportion of Immigrants from Hong Kong and percentage of population receiving government assistance and/or food stamps in the United States with a correlation coefficient (R) of -0.223 and weighted average of 9.1%. Similarly, the statistical analysis conducted on geographies consisting of 508,812,505 people shows a moderate positive correlation between the proportion of Koreans and percentage of population receiving government assistance and/or food stamps in the United States with a correlation coefficient (R) of 0.436 and weighted average of 10.4%, a difference of 14.4%.
Receiving Food Stamps Correlation Summary
| Measurement | Immigrants from Hong Kong | Korean |
| Minimum | 0.50% | 2.7% |
| Maximum | 20.6% | 50.0% |
| Range | 20.1% | 47.3% |
| Mean | 7.4% | 12.5% |
| Median | 7.0% | 10.1% |
| Interquartile 25% (IQ1) | 5.1% | 8.6% |
| Interquartile 75% (IQ3) | 9.0% | 13.7% |
| Interquartile Range (IQR) | 3.9% | 5.1% |
| Standard Deviation (Sample) | 3.8% | 7.2% |
| Standard Deviation (Population) | 3.8% | 7.2% |
Similar Demographics by Receiving Food Stamps
Demographics Similar to Immigrants from Hong Kong by Receiving Food Stamps
In terms of receiving food stamps, the demographic groups most similar to Immigrants from Hong Kong are Latvian (9.1%, a difference of 0.33%), Luxembourger (9.1%, a difference of 0.48%), Danish (9.0%, a difference of 0.58%), Immigrants from Australia (9.2%, a difference of 0.73%), and Eastern European (9.2%, a difference of 0.84%).
| Demographics | Rating | Rank | Receiving Food Stamps |
| Cypriots | 99.9 /100 | #12 | Exceptional 8.9% |
| Bulgarians | 99.9 /100 | #13 | Exceptional 8.9% |
| Maltese | 99.9 /100 | #14 | Exceptional 8.9% |
| Norwegians | 99.9 /100 | #15 | Exceptional 9.0% |
| Immigrants | Japan | 99.9 /100 | #16 | Exceptional 9.0% |
| Immigrants | Scotland | 99.9 /100 | #17 | Exceptional 9.0% |
| Danes | 99.9 /100 | #18 | Exceptional 9.0% |
| Immigrants | Hong Kong | 99.8 /100 | #19 | Exceptional 9.1% |
| Latvians | 99.8 /100 | #20 | Exceptional 9.1% |
| Luxembourgers | 99.8 /100 | #21 | Exceptional 9.1% |
| Immigrants | Australia | 99.8 /100 | #22 | Exceptional 9.2% |
| Eastern Europeans | 99.8 /100 | #23 | Exceptional 9.2% |
| Immigrants | Northern Europe | 99.8 /100 | #24 | Exceptional 9.2% |
| Immigrants | Ireland | 99.8 /100 | #25 | Exceptional 9.2% |
| Swedes | 99.8 /100 | #26 | Exceptional 9.2% |
Demographics Similar to Koreans by Receiving Food Stamps
In terms of receiving food stamps, the demographic groups most similar to Koreans are Carpatho Rusyn (10.4%, a difference of 0.030%), Immigrants from Pakistan (10.4%, a difference of 0.080%), Immigrants from Italy (10.4%, a difference of 0.15%), Immigrants from Malaysia (10.4%, a difference of 0.24%), and Pakistani (10.4%, a difference of 0.36%).
| Demographics | Rating | Rank | Receiving Food Stamps |
| Immigrants | Western Europe | 96.9 /100 | #100 | Exceptional 10.3% |
| Palestinians | 96.9 /100 | #101 | Exceptional 10.3% |
| Immigrants | Europe | 96.8 /100 | #102 | Exceptional 10.3% |
| Immigrants | Latvia | 96.8 /100 | #103 | Exceptional 10.3% |
| Immigrants | Hungary | 96.7 /100 | #104 | Exceptional 10.3% |
| Immigrants | Malaysia | 96.5 /100 | #105 | Exceptional 10.4% |
| Immigrants | Italy | 96.4 /100 | #106 | Exceptional 10.4% |
| Koreans | 96.3 /100 | #107 | Exceptional 10.4% |
| Carpatho Rusyns | 96.2 /100 | #108 | Exceptional 10.4% |
| Immigrants | Pakistan | 96.2 /100 | #109 | Exceptional 10.4% |
| Pakistanis | 95.9 /100 | #110 | Exceptional 10.4% |
| Romanians | 95.8 /100 | #111 | Exceptional 10.4% |
| Mongolians | 95.8 /100 | #112 | Exceptional 10.5% |
| Icelanders | 95.4 /100 | #113 | Exceptional 10.5% |
| Scotch-Irish | 95.1 /100 | #114 | Exceptional 10.5% |