Comanche vs Korean Receiving Food Stamps
COMPARE
Comanche
Korean
Receiving Food Stamps
Receiving Food Stamps Comparison
Comanche
Koreans
13.3%
RECEIVING FOOD STAMPS
2.4/ 100
METRIC RATING
234th/ 347
METRIC RANK
10.4%
RECEIVING FOOD STAMPS
96.3/ 100
METRIC RATING
107th/ 347
METRIC RANK
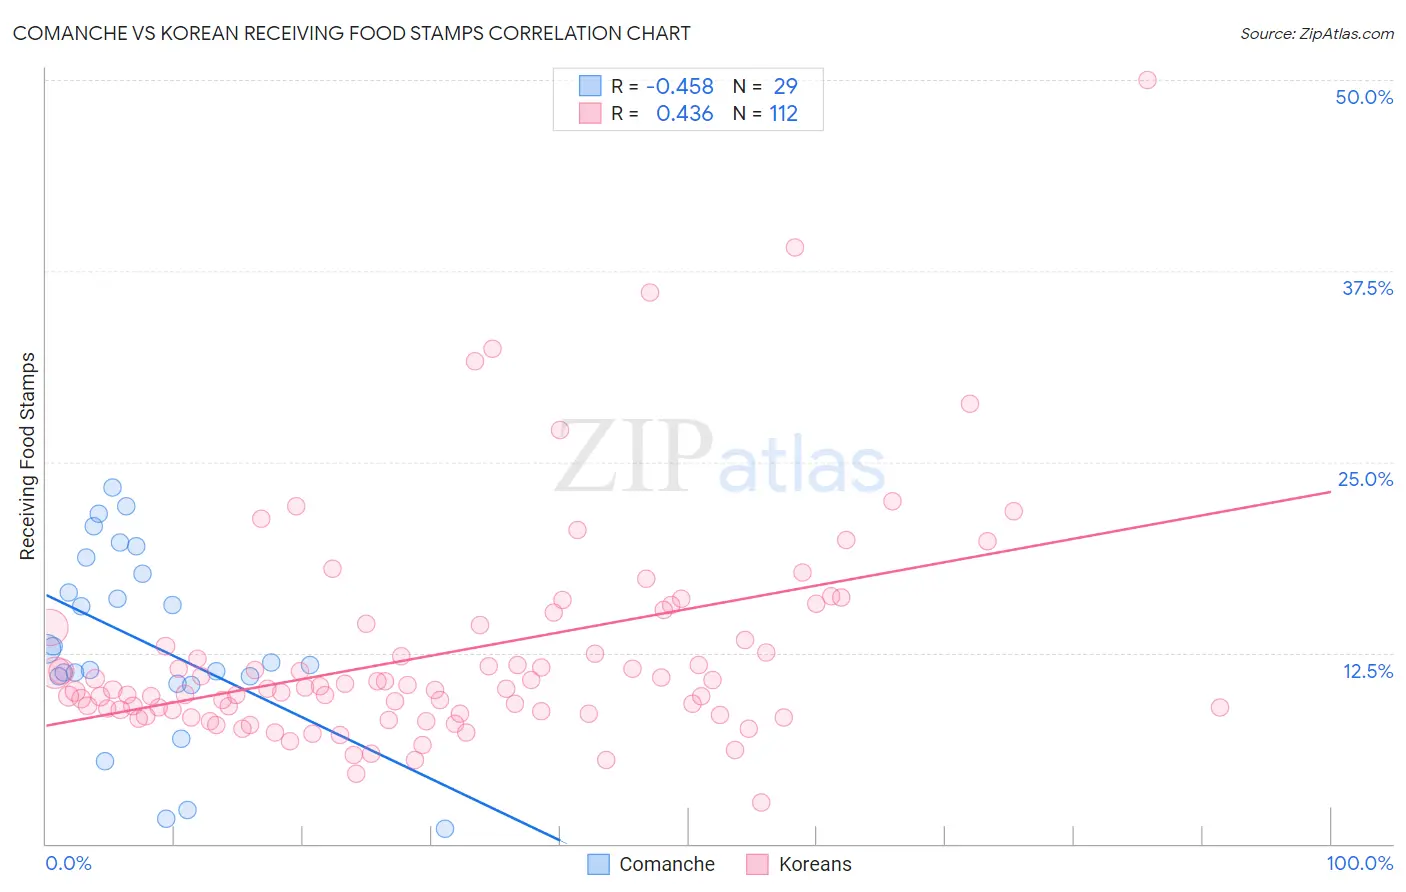
Comanche vs Korean Receiving Food Stamps Correlation Chart
The statistical analysis conducted on geographies consisting of 109,741,835 people shows a moderate negative correlation between the proportion of Comanche and percentage of population receiving government assistance and/or food stamps in the United States with a correlation coefficient (R) of -0.458 and weighted average of 13.3%. Similarly, the statistical analysis conducted on geographies consisting of 508,812,505 people shows a moderate positive correlation between the proportion of Koreans and percentage of population receiving government assistance and/or food stamps in the United States with a correlation coefficient (R) of 0.436 and weighted average of 10.4%, a difference of 27.5%.
Receiving Food Stamps Correlation Summary
| Measurement | Comanche | Korean |
| Minimum | 1.0% | 2.7% |
| Maximum | 23.3% | 50.0% |
| Range | 22.3% | 47.3% |
| Mean | 13.1% | 12.5% |
| Median | 11.9% | 10.1% |
| Interquartile 25% (IQ1) | 10.7% | 8.6% |
| Interquartile 75% (IQ3) | 18.2% | 13.7% |
| Interquartile Range (IQR) | 7.5% | 5.1% |
| Standard Deviation (Sample) | 6.0% | 7.2% |
| Standard Deviation (Population) | 5.9% | 7.2% |
Similar Demographics by Receiving Food Stamps
Demographics Similar to Comanche by Receiving Food Stamps
In terms of receiving food stamps, the demographic groups most similar to Comanche are Cherokee (13.2%, a difference of 0.13%), Salvadoran (13.2%, a difference of 0.38%), Immigrants from Zaire (13.4%, a difference of 0.77%), Immigrants from Nigeria (13.1%, a difference of 1.1%), and Puget Sound Salish (13.1%, a difference of 1.1%).
| Demographics | Rating | Rank | Receiving Food Stamps |
| Nigerians | 3.5 /100 | #227 | Tragic 13.1% |
| Panamanians | 3.5 /100 | #228 | Tragic 13.1% |
| Ottawa | 3.5 /100 | #229 | Tragic 13.1% |
| Puget Sound Salish | 3.4 /100 | #230 | Tragic 13.1% |
| Immigrants | Nigeria | 3.4 /100 | #231 | Tragic 13.1% |
| Salvadorans | 2.7 /100 | #232 | Tragic 13.2% |
| Cherokee | 2.5 /100 | #233 | Tragic 13.2% |
| Comanche | 2.4 /100 | #234 | Tragic 13.3% |
| Immigrants | Zaire | 1.9 /100 | #235 | Tragic 13.4% |
| Crow | 1.6 /100 | #236 | Tragic 13.4% |
| Immigrants | El Salvador | 1.5 /100 | #237 | Tragic 13.5% |
| French American Indians | 1.4 /100 | #238 | Tragic 13.5% |
| Immigrants | Micronesia | 1.3 /100 | #239 | Tragic 13.5% |
| Iroquois | 1.2 /100 | #240 | Tragic 13.5% |
| Choctaw | 1.0 /100 | #241 | Tragic 13.6% |
Demographics Similar to Koreans by Receiving Food Stamps
In terms of receiving food stamps, the demographic groups most similar to Koreans are Carpatho Rusyn (10.4%, a difference of 0.030%), Immigrants from Pakistan (10.4%, a difference of 0.080%), Immigrants from Italy (10.4%, a difference of 0.15%), Immigrants from Malaysia (10.4%, a difference of 0.24%), and Pakistani (10.4%, a difference of 0.36%).
| Demographics | Rating | Rank | Receiving Food Stamps |
| Immigrants | Western Europe | 96.9 /100 | #100 | Exceptional 10.3% |
| Palestinians | 96.9 /100 | #101 | Exceptional 10.3% |
| Immigrants | Europe | 96.8 /100 | #102 | Exceptional 10.3% |
| Immigrants | Latvia | 96.8 /100 | #103 | Exceptional 10.3% |
| Immigrants | Hungary | 96.7 /100 | #104 | Exceptional 10.3% |
| Immigrants | Malaysia | 96.5 /100 | #105 | Exceptional 10.4% |
| Immigrants | Italy | 96.4 /100 | #106 | Exceptional 10.4% |
| Koreans | 96.3 /100 | #107 | Exceptional 10.4% |
| Carpatho Rusyns | 96.2 /100 | #108 | Exceptional 10.4% |
| Immigrants | Pakistan | 96.2 /100 | #109 | Exceptional 10.4% |
| Pakistanis | 95.9 /100 | #110 | Exceptional 10.4% |
| Romanians | 95.8 /100 | #111 | Exceptional 10.4% |
| Mongolians | 95.8 /100 | #112 | Exceptional 10.5% |
| Icelanders | 95.4 /100 | #113 | Exceptional 10.5% |
| Scotch-Irish | 95.1 /100 | #114 | Exceptional 10.5% |