Tsimshian vs Mexican American Indian Disability
COMPARE
Tsimshian
Mexican American Indian
Disability
Disability Comparison
Tsimshian
Mexican American Indians
16.1%
DISABILITY
0.0/ 100
METRIC RATING
346th/ 347
METRIC RANK
12.0%
DISABILITY
11.4/ 100
METRIC RATING
204th/ 347
METRIC RANK
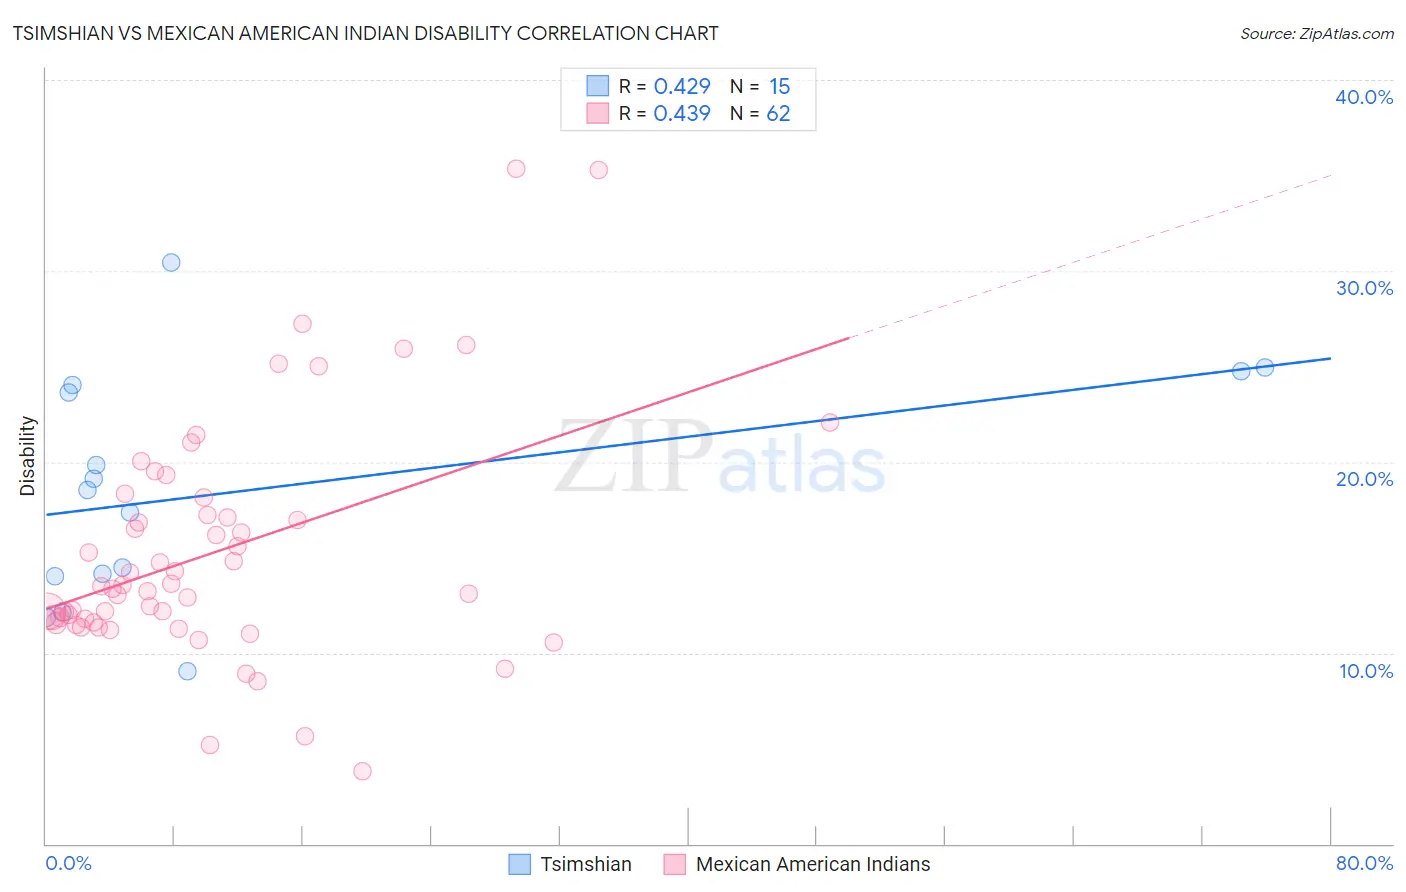
Tsimshian vs Mexican American Indian Disability Correlation Chart
The statistical analysis conducted on geographies consisting of 15,626,544 people shows a moderate positive correlation between the proportion of Tsimshian and percentage of population with a disability in the United States with a correlation coefficient (R) of 0.429 and weighted average of 16.1%. Similarly, the statistical analysis conducted on geographies consisting of 317,572,347 people shows a moderate positive correlation between the proportion of Mexican American Indians and percentage of population with a disability in the United States with a correlation coefficient (R) of 0.439 and weighted average of 12.0%, a difference of 34.9%.
Disability Correlation Summary
| Measurement | Tsimshian | Mexican American Indian |
| Minimum | 9.0% | 3.8% |
| Maximum | 30.5% | 35.4% |
| Range | 21.5% | 31.6% |
| Mean | 18.5% | 15.3% |
| Median | 18.5% | 13.4% |
| Interquartile 25% (IQ1) | 14.0% | 11.6% |
| Interquartile 75% (IQ3) | 24.0% | 17.2% |
| Interquartile Range (IQR) | 10.0% | 5.6% |
| Standard Deviation (Sample) | 6.1% | 6.2% |
| Standard Deviation (Population) | 5.9% | 6.1% |
Similar Demographics by Disability
Demographics Similar to Tsimshian by Disability
In terms of disability, the demographic groups most similar to Tsimshian are Puerto Rican (16.1%, a difference of 0.16%), Colville (15.8%, a difference of 2.2%), Creek (15.6%, a difference of 3.5%), Kiowa (15.6%, a difference of 3.5%), and Lumbee (15.5%, a difference of 3.9%).
| Demographics | Rating | Rank | Disability |
| Cajuns | 0.0 /100 | #333 | Tragic 14.6% |
| Yuman | 0.0 /100 | #334 | Tragic 14.6% |
| Tohono O'odham | 0.0 /100 | #335 | Tragic 14.8% |
| Cherokee | 0.0 /100 | #336 | Tragic 14.8% |
| Seminole | 0.0 /100 | #337 | Tragic 14.9% |
| Dutch West Indians | 0.0 /100 | #338 | Tragic 14.9% |
| Chickasaw | 0.0 /100 | #339 | Tragic 15.2% |
| Choctaw | 0.0 /100 | #340 | Tragic 15.4% |
| Lumbee | 0.0 /100 | #341 | Tragic 15.5% |
| Kiowa | 0.0 /100 | #342 | Tragic 15.6% |
| Creek | 0.0 /100 | #343 | Tragic 15.6% |
| Colville | 0.0 /100 | #344 | Tragic 15.8% |
| Puerto Ricans | 0.0 /100 | #345 | Tragic 16.1% |
| Tsimshian | 0.0 /100 | #346 | Tragic 16.1% |
| Houma | 0.0 /100 | #347 | Tragic 17.1% |
Demographics Similar to Mexican American Indians by Disability
In terms of disability, the demographic groups most similar to Mexican American Indians are British West Indian (12.0%, a difference of 0.0%), Immigrants from England (12.0%, a difference of 0.050%), Assyrian/Chaldean/Syriac (11.9%, a difference of 0.12%), Belizean (11.9%, a difference of 0.14%), and Immigrants from Western Europe (12.0%, a difference of 0.16%).
| Demographics | Rating | Rank | Disability |
| Immigrants | Belize | 15.2 /100 | #197 | Poor 11.9% |
| Ukrainians | 14.7 /100 | #198 | Poor 11.9% |
| Immigrants | Panama | 14.6 /100 | #199 | Poor 11.9% |
| Belizeans | 12.8 /100 | #200 | Poor 11.9% |
| Assyrians/Chaldeans/Syriacs | 12.6 /100 | #201 | Poor 11.9% |
| Immigrants | England | 12.0 /100 | #202 | Poor 12.0% |
| British West Indians | 11.5 /100 | #203 | Poor 12.0% |
| Mexican American Indians | 11.4 /100 | #204 | Poor 12.0% |
| Immigrants | Western Europe | 10.1 /100 | #205 | Poor 12.0% |
| Immigrants | Senegal | 9.4 /100 | #206 | Tragic 12.0% |
| Immigrants | Thailand | 9.3 /100 | #207 | Tragic 12.0% |
| Immigrants | Caribbean | 9.1 /100 | #208 | Tragic 12.0% |
| Danes | 8.7 /100 | #209 | Tragic 12.0% |
| Czechs | 7.9 /100 | #210 | Tragic 12.0% |
| Immigrants | Cambodia | 7.3 /100 | #211 | Tragic 12.0% |