Immigrants from Dominican Republic vs Mexican American Indian Single Father Poverty
COMPARE
Immigrants from Dominican Republic
Mexican American Indian
Single Father Poverty
Single Father Poverty Comparison
Immigrants from Dominican Republic
Mexican American Indians
18.4%
SINGLE FATHER POVERTY
0.0/ 100
METRIC RATING
300th/ 347
METRIC RANK
15.5%
SINGLE FATHER POVERTY
98.7/ 100
METRIC RATING
90th/ 347
METRIC RANK
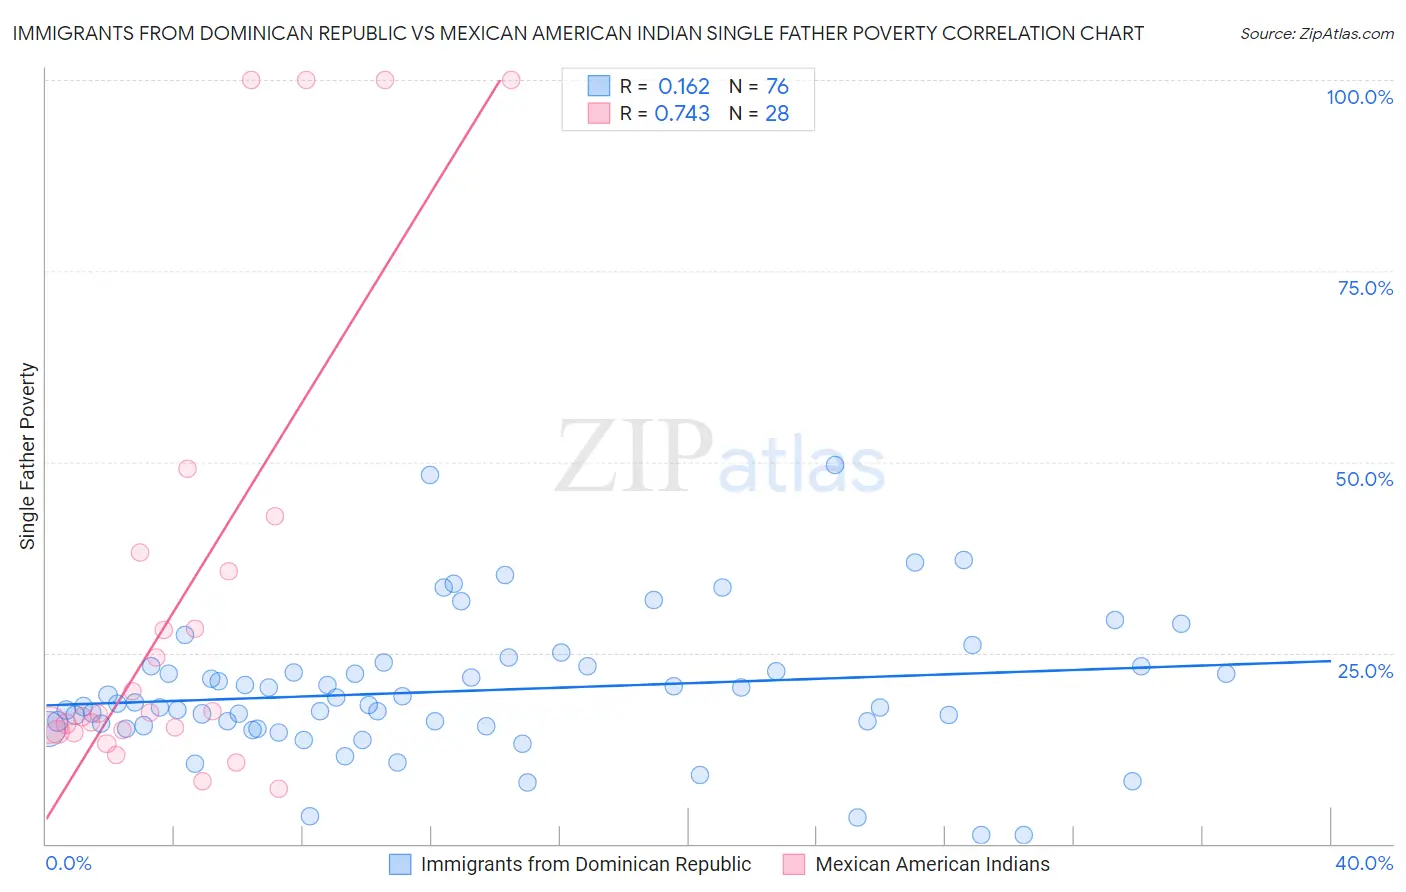
Immigrants from Dominican Republic vs Mexican American Indian Single Father Poverty Correlation Chart
The statistical analysis conducted on geographies consisting of 226,907,636 people shows a poor positive correlation between the proportion of Immigrants from Dominican Republic and poverty level among single fathers in the United States with a correlation coefficient (R) of 0.162 and weighted average of 18.4%. Similarly, the statistical analysis conducted on geographies consisting of 266,902,883 people shows a strong positive correlation between the proportion of Mexican American Indians and poverty level among single fathers in the United States with a correlation coefficient (R) of 0.743 and weighted average of 15.5%, a difference of 18.7%.
Single Father Poverty Correlation Summary
| Measurement | Immigrants from Dominican Republic | Mexican American Indian |
| Minimum | 1.2% | 7.3% |
| Maximum | 49.7% | 100.0% |
| Range | 48.4% | 92.7% |
| Mean | 20.0% | 31.8% |
| Median | 18.2% | 17.1% |
| Interquartile 25% (IQ1) | 15.4% | 14.8% |
| Interquartile 75% (IQ3) | 23.2% | 36.9% |
| Interquartile Range (IQR) | 7.8% | 22.1% |
| Standard Deviation (Sample) | 9.0% | 30.1% |
| Standard Deviation (Population) | 9.0% | 29.6% |
Similar Demographics by Single Father Poverty
Demographics Similar to Immigrants from Dominican Republic by Single Father Poverty
In terms of single father poverty, the demographic groups most similar to Immigrants from Dominican Republic are Hungarian (18.5%, a difference of 0.22%), White/Caucasian (18.4%, a difference of 0.32%), Comanche (18.5%, a difference of 0.32%), Celtic (18.5%, a difference of 0.37%), and Ute (18.5%, a difference of 0.51%).
| Demographics | Rating | Rank | Single Father Poverty |
| Alaska Natives | 0.0 /100 | #293 | Tragic 18.1% |
| U.S. Virgin Islanders | 0.0 /100 | #294 | Tragic 18.1% |
| Yakama | 0.0 /100 | #295 | Tragic 18.1% |
| Seminole | 0.0 /100 | #296 | Tragic 18.1% |
| French | 0.0 /100 | #297 | Tragic 18.2% |
| Africans | 0.0 /100 | #298 | Tragic 18.3% |
| Whites/Caucasians | 0.0 /100 | #299 | Tragic 18.4% |
| Immigrants | Dominican Republic | 0.0 /100 | #300 | Tragic 18.4% |
| Hungarians | 0.0 /100 | #301 | Tragic 18.5% |
| Comanche | 0.0 /100 | #302 | Tragic 18.5% |
| Celtics | 0.0 /100 | #303 | Tragic 18.5% |
| Ute | 0.0 /100 | #304 | Tragic 18.5% |
| Blackfeet | 0.0 /100 | #305 | Tragic 18.5% |
| Scotch-Irish | 0.0 /100 | #306 | Tragic 18.6% |
| French Canadians | 0.0 /100 | #307 | Tragic 18.6% |
Demographics Similar to Mexican American Indians by Single Father Poverty
In terms of single father poverty, the demographic groups most similar to Mexican American Indians are Immigrants from Romania (15.5%, a difference of 0.10%), Immigrants from Serbia (15.5%, a difference of 0.21%), Immigrants from Korea (15.5%, a difference of 0.23%), Basque (15.5%, a difference of 0.25%), and Burmese (15.5%, a difference of 0.29%).
| Demographics | Rating | Rank | Single Father Poverty |
| Chinese | 99.3 /100 | #83 | Exceptional 15.4% |
| Peruvians | 99.2 /100 | #84 | Exceptional 15.4% |
| Immigrants | Oceania | 99.1 /100 | #85 | Exceptional 15.4% |
| Immigrants | Russia | 99.0 /100 | #86 | Exceptional 15.5% |
| Brazilians | 99.0 /100 | #87 | Exceptional 15.5% |
| Burmese | 99.0 /100 | #88 | Exceptional 15.5% |
| Immigrants | Korea | 99.0 /100 | #89 | Exceptional 15.5% |
| Mexican American Indians | 98.7 /100 | #90 | Exceptional 15.5% |
| Immigrants | Romania | 98.6 /100 | #91 | Exceptional 15.5% |
| Immigrants | Serbia | 98.5 /100 | #92 | Exceptional 15.5% |
| Basques | 98.4 /100 | #93 | Exceptional 15.5% |
| Immigrants | Uruguay | 98.2 /100 | #94 | Exceptional 15.6% |
| Immigrants | Kazakhstan | 98.2 /100 | #95 | Exceptional 15.6% |
| Immigrants | Belgium | 98.1 /100 | #96 | Exceptional 15.6% |
| Yaqui | 98.1 /100 | #97 | Exceptional 15.6% |