Tsimshian vs Mexican American Indian College, Under 1 year
COMPARE
Tsimshian
Mexican American Indian
College, Under 1 year
College, Under 1 year Comparison
Tsimshian
Mexican American Indians
64.3%
COLLEGE, UNDER 1 YEAR
17.9/ 100
METRIC RATING
198th/ 347
METRIC RANK
58.1%
COLLEGE, UNDER 1 YEAR
0.0/ 100
METRIC RATING
301st/ 347
METRIC RANK
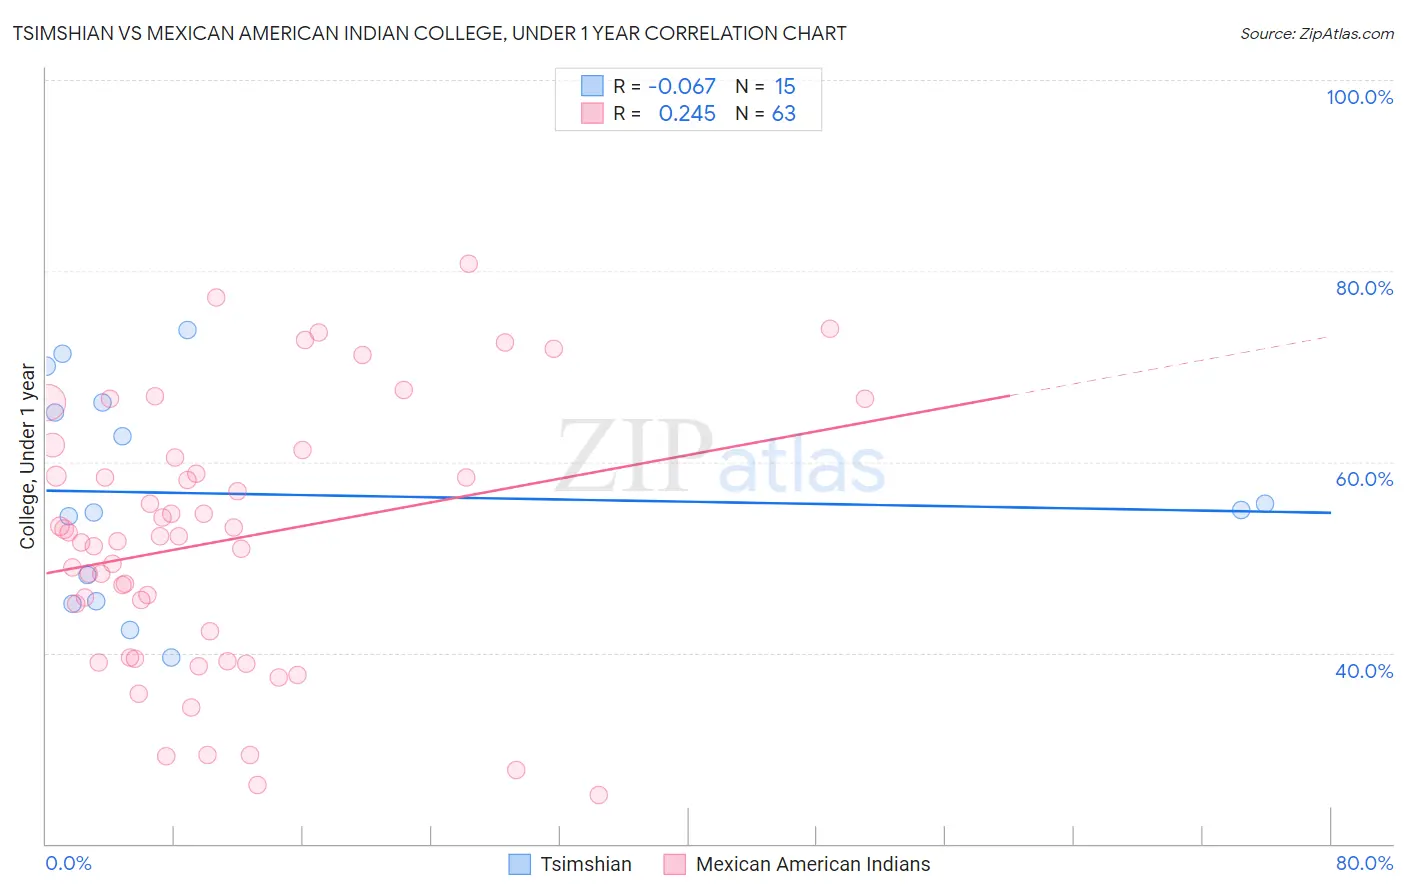
Tsimshian vs Mexican American Indian College, Under 1 year Correlation Chart
The statistical analysis conducted on geographies consisting of 15,626,544 people shows a slight negative correlation between the proportion of Tsimshian and percentage of population with at least college, under 1 year education in the United States with a correlation coefficient (R) of -0.067 and weighted average of 64.3%. Similarly, the statistical analysis conducted on geographies consisting of 317,621,155 people shows a weak positive correlation between the proportion of Mexican American Indians and percentage of population with at least college, under 1 year education in the United States with a correlation coefficient (R) of 0.245 and weighted average of 58.1%, a difference of 10.6%.
College, Under 1 year Correlation Summary
| Measurement | Tsimshian | Mexican American Indian |
| Minimum | 39.5% | 25.1% |
| Maximum | 73.8% | 80.8% |
| Range | 34.3% | 55.6% |
| Mean | 56.6% | 51.8% |
| Median | 54.9% | 52.2% |
| Interquartile 25% (IQ1) | 45.5% | 39.5% |
| Interquartile 75% (IQ3) | 66.2% | 60.4% |
| Interquartile Range (IQR) | 20.8% | 20.9% |
| Standard Deviation (Sample) | 11.1% | 13.6% |
| Standard Deviation (Population) | 10.7% | 13.5% |
Similar Demographics by College, Under 1 year
Demographics Similar to Tsimshian by College, Under 1 year
In terms of college, under 1 year, the demographic groups most similar to Tsimshian are Panamanian (64.3%, a difference of 0.070%), Nigerian (64.3%, a difference of 0.090%), Costa Rican (64.4%, a difference of 0.13%), French Canadian (64.2%, a difference of 0.13%), and South American (64.2%, a difference of 0.13%).
| Demographics | Rating | Rank | College, Under 1 year |
| Immigrants | Armenia | 28.1 /100 | #191 | Fair 64.7% |
| Immigrants | Thailand | 27.0 /100 | #192 | Fair 64.7% |
| Slovaks | 26.7 /100 | #193 | Fair 64.7% |
| Immigrants | Cameroon | 24.6 /100 | #194 | Fair 64.6% |
| Immigrants | South Eastern Asia | 22.1 /100 | #195 | Fair 64.5% |
| Tongans | 21.2 /100 | #196 | Fair 64.5% |
| Costa Ricans | 19.6 /100 | #197 | Poor 64.4% |
| Tsimshian | 17.9 /100 | #198 | Poor 64.3% |
| Panamanians | 17.0 /100 | #199 | Poor 64.3% |
| Nigerians | 16.7 /100 | #200 | Poor 64.3% |
| French Canadians | 16.3 /100 | #201 | Poor 64.2% |
| South Americans | 16.2 /100 | #202 | Poor 64.2% |
| Uruguayans | 15.6 /100 | #203 | Poor 64.2% |
| Immigrants | Zaire | 14.6 /100 | #204 | Poor 64.1% |
| Peruvians | 13.7 /100 | #205 | Poor 64.1% |
Demographics Similar to Mexican American Indians by College, Under 1 year
In terms of college, under 1 year, the demographic groups most similar to Mexican American Indians are Apache (58.0%, a difference of 0.19%), Immigrants from Dominica (57.9%, a difference of 0.48%), Kiowa (57.8%, a difference of 0.49%), Haitian (57.8%, a difference of 0.61%), and Immigrants from Guyana (58.5%, a difference of 0.62%).
| Demographics | Rating | Rank | College, Under 1 year |
| Immigrants | Belize | 0.0 /100 | #294 | Tragic 59.1% |
| Immigrants | Grenada | 0.0 /100 | #295 | Tragic 59.1% |
| Central American Indians | 0.0 /100 | #296 | Tragic 59.0% |
| Guyanese | 0.0 /100 | #297 | Tragic 59.0% |
| Immigrants | Ecuador | 0.0 /100 | #298 | Tragic 58.7% |
| Cubans | 0.0 /100 | #299 | Tragic 58.6% |
| Immigrants | Guyana | 0.0 /100 | #300 | Tragic 58.5% |
| Mexican American Indians | 0.0 /100 | #301 | Tragic 58.1% |
| Apache | 0.0 /100 | #302 | Tragic 58.0% |
| Immigrants | Dominica | 0.0 /100 | #303 | Tragic 57.9% |
| Kiowa | 0.0 /100 | #304 | Tragic 57.8% |
| Haitians | 0.0 /100 | #305 | Tragic 57.8% |
| Immigrants | Portugal | 0.0 /100 | #306 | Tragic 57.7% |
| Fijians | 0.0 /100 | #307 | Tragic 57.7% |
| Central Americans | 0.0 /100 | #308 | Tragic 57.7% |