Danish vs Immigrants from Nepal Single Father Poverty
COMPARE
Danish
Immigrants from Nepal
Single Father Poverty
Single Father Poverty Comparison
Danes
Immigrants from Nepal
15.8%
SINGLE FATHER POVERTY
94.5/ 100
METRIC RATING
113th/ 347
METRIC RANK
14.8%
SINGLE FATHER POVERTY
100.0/ 100
METRIC RATING
42nd/ 347
METRIC RANK
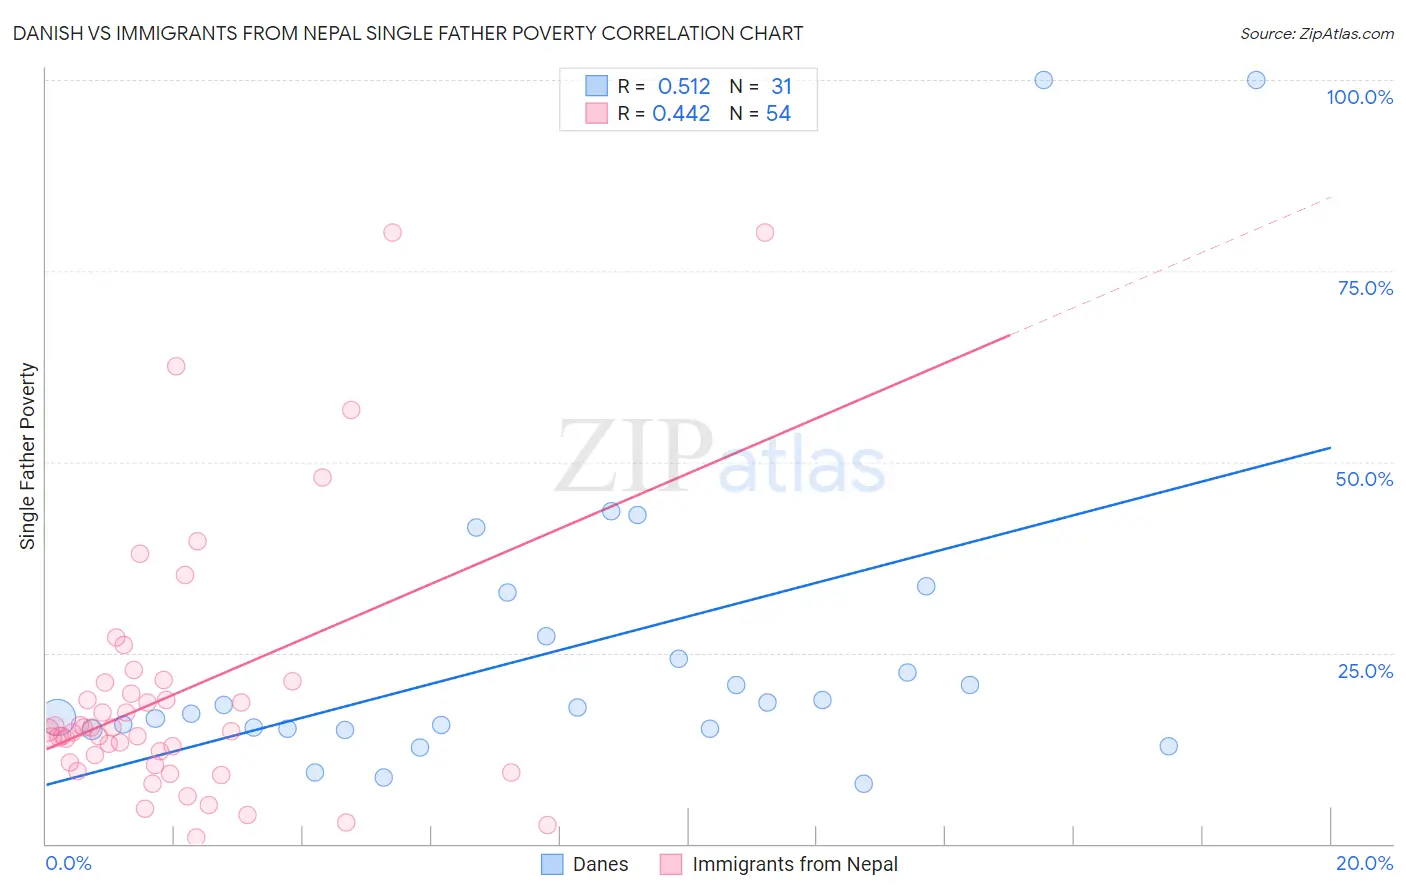
Danish vs Immigrants from Nepal Single Father Poverty Correlation Chart
The statistical analysis conducted on geographies consisting of 352,960,899 people shows a substantial positive correlation between the proportion of Danes and poverty level among single fathers in the United States with a correlation coefficient (R) of 0.512 and weighted average of 15.8%. Similarly, the statistical analysis conducted on geographies consisting of 159,641,053 people shows a moderate positive correlation between the proportion of Immigrants from Nepal and poverty level among single fathers in the United States with a correlation coefficient (R) of 0.442 and weighted average of 14.8%, a difference of 6.7%.
Single Father Poverty Correlation Summary
| Measurement | Danish | Immigrants from Nepal |
| Minimum | 7.9% | 0.76% |
| Maximum | 100.0% | 80.0% |
| Range | 92.1% | 79.2% |
| Mean | 25.5% | 19.8% |
| Median | 17.9% | 14.8% |
| Interquartile 25% (IQ1) | 15.1% | 10.7% |
| Interquartile 75% (IQ3) | 27.1% | 21.1% |
| Interquartile Range (IQR) | 12.0% | 10.5% |
| Standard Deviation (Sample) | 22.0% | 17.1% |
| Standard Deviation (Population) | 21.6% | 17.0% |
Similar Demographics by Single Father Poverty
Demographics Similar to Danes by Single Father Poverty
In terms of single father poverty, the demographic groups most similar to Danes are Argentinean (15.8%, a difference of 0.020%), Immigrants from Latvia (15.8%, a difference of 0.040%), Bulgarian (15.8%, a difference of 0.080%), Immigrants from Africa (15.8%, a difference of 0.13%), and Turkish (15.8%, a difference of 0.14%).
| Demographics | Rating | Rank | Single Father Poverty |
| Immigrants | Poland | 95.8 /100 | #106 | Exceptional 15.7% |
| Native Hawaiians | 95.8 /100 | #107 | Exceptional 15.7% |
| Pakistanis | 95.7 /100 | #108 | Exceptional 15.7% |
| Turks | 95.1 /100 | #109 | Exceptional 15.8% |
| Immigrants | Africa | 95.1 /100 | #110 | Exceptional 15.8% |
| Bulgarians | 94.8 /100 | #111 | Exceptional 15.8% |
| Immigrants | Latvia | 94.7 /100 | #112 | Exceptional 15.8% |
| Danes | 94.5 /100 | #113 | Exceptional 15.8% |
| Argentineans | 94.4 /100 | #114 | Exceptional 15.8% |
| Immigrants | Thailand | 93.6 /100 | #115 | Exceptional 15.8% |
| Immigrants | Argentina | 92.8 /100 | #116 | Exceptional 15.8% |
| Immigrants | Colombia | 92.6 /100 | #117 | Exceptional 15.8% |
| Immigrants | Eastern Europe | 92.5 /100 | #118 | Exceptional 15.8% |
| Immigrants | Belarus | 92.4 /100 | #119 | Exceptional 15.8% |
| Uruguayans | 92.1 /100 | #120 | Exceptional 15.9% |
Demographics Similar to Immigrants from Nepal by Single Father Poverty
In terms of single father poverty, the demographic groups most similar to Immigrants from Nepal are Indian (Asian) (14.8%, a difference of 0.0%), Immigrants from Eritrea (14.8%, a difference of 0.040%), Pima (14.8%, a difference of 0.17%), Immigrants from Asia (14.7%, a difference of 0.37%), and Bolivian (14.7%, a difference of 0.55%).
| Demographics | Rating | Rank | Single Father Poverty |
| Immigrants | Bolivia | 100.0 /100 | #35 | Exceptional 14.7% |
| Immigrants | Indonesia | 100.0 /100 | #36 | Exceptional 14.7% |
| Immigrants | Eastern Africa | 100.0 /100 | #37 | Exceptional 14.7% |
| Bolivians | 100.0 /100 | #38 | Exceptional 14.7% |
| Immigrants | Asia | 100.0 /100 | #39 | Exceptional 14.7% |
| Pima | 100.0 /100 | #40 | Exceptional 14.8% |
| Indians (Asian) | 100.0 /100 | #41 | Exceptional 14.8% |
| Immigrants | Nepal | 100.0 /100 | #42 | Exceptional 14.8% |
| Immigrants | Eritrea | 100.0 /100 | #43 | Exceptional 14.8% |
| Salvadorans | 100.0 /100 | #44 | Exceptional 14.9% |
| Immigrants | Somalia | 100.0 /100 | #45 | Exceptional 14.9% |
| Immigrants | Cambodia | 99.9 /100 | #46 | Exceptional 14.9% |
| Immigrants | China | 99.9 /100 | #47 | Exceptional 14.9% |
| Malaysians | 99.9 /100 | #48 | Exceptional 14.9% |
| Immigrants | Eastern Asia | 99.9 /100 | #49 | Exceptional 15.0% |