Canadian vs Immigrants from Nepal Single Father Poverty
COMPARE
Canadian
Immigrants from Nepal
Single Father Poverty
Single Father Poverty Comparison
Canadians
Immigrants from Nepal
17.1%
SINGLE FATHER POVERTY
1.3/ 100
METRIC RATING
249th/ 347
METRIC RANK
14.8%
SINGLE FATHER POVERTY
100.0/ 100
METRIC RATING
42nd/ 347
METRIC RANK
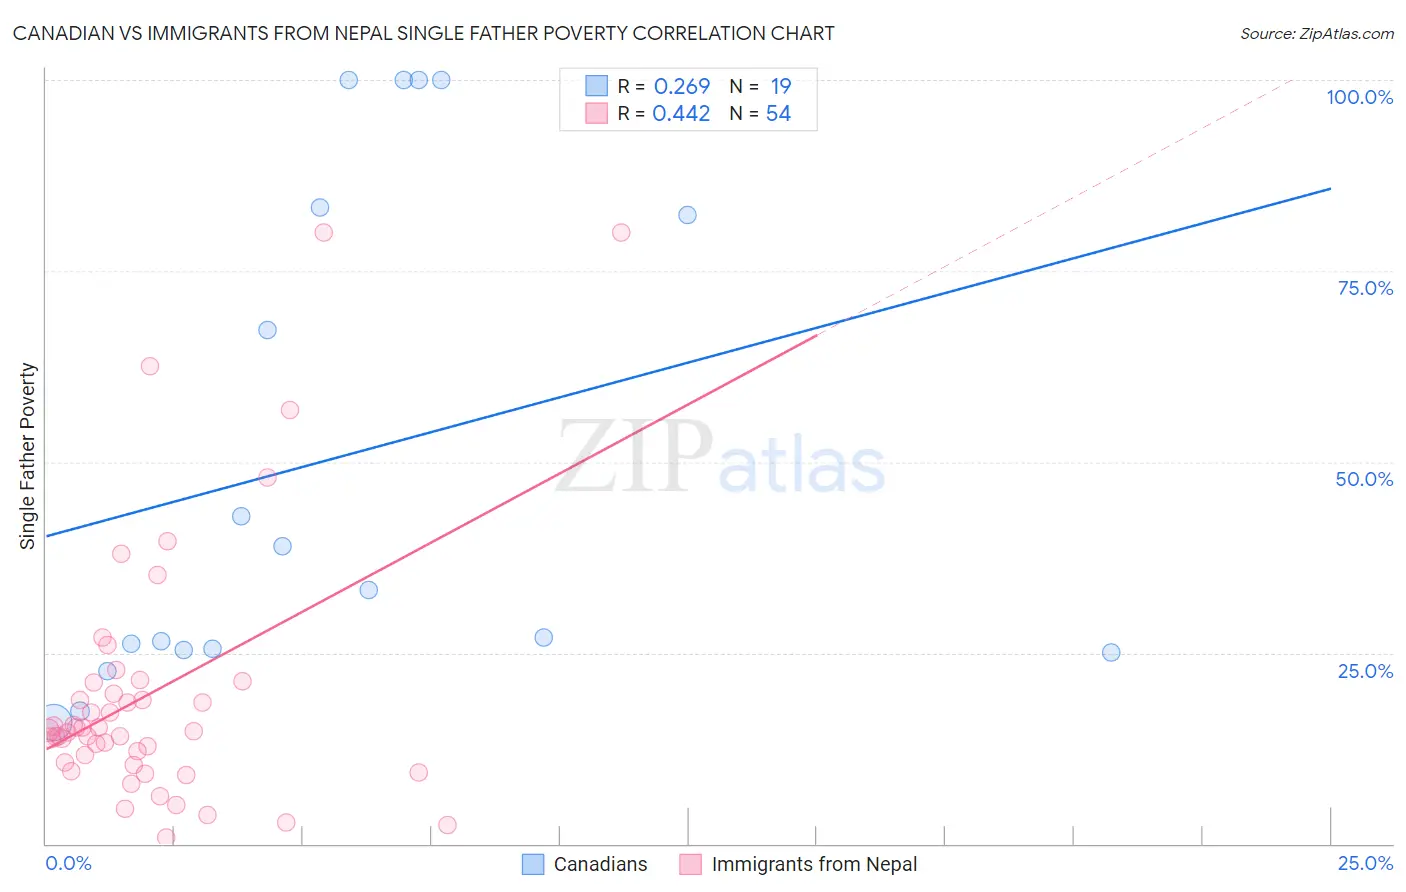
Canadian vs Immigrants from Nepal Single Father Poverty Correlation Chart
The statistical analysis conducted on geographies consisting of 333,608,234 people shows a weak positive correlation between the proportion of Canadians and poverty level among single fathers in the United States with a correlation coefficient (R) of 0.269 and weighted average of 17.1%. Similarly, the statistical analysis conducted on geographies consisting of 159,641,053 people shows a moderate positive correlation between the proportion of Immigrants from Nepal and poverty level among single fathers in the United States with a correlation coefficient (R) of 0.442 and weighted average of 14.8%, a difference of 15.5%.
Single Father Poverty Correlation Summary
| Measurement | Canadian | Immigrants from Nepal |
| Minimum | 15.9% | 0.76% |
| Maximum | 100.0% | 80.0% |
| Range | 84.1% | 79.2% |
| Mean | 50.5% | 19.8% |
| Median | 33.2% | 14.8% |
| Interquartile 25% (IQ1) | 25.4% | 10.7% |
| Interquartile 75% (IQ3) | 83.3% | 21.1% |
| Interquartile Range (IQR) | 57.9% | 10.5% |
| Standard Deviation (Sample) | 32.8% | 17.1% |
| Standard Deviation (Population) | 31.9% | 17.0% |
Similar Demographics by Single Father Poverty
Demographics Similar to Canadians by Single Father Poverty
In terms of single father poverty, the demographic groups most similar to Canadians are Czechoslovakian (17.1%, a difference of 0.040%), Greek (17.1%, a difference of 0.050%), Austrian (17.1%, a difference of 0.13%), Luxembourger (17.1%, a difference of 0.14%), and Immigrants from Ireland (17.1%, a difference of 0.15%).
| Demographics | Rating | Rank | Single Father Poverty |
| Moroccans | 2.1 /100 | #242 | Tragic 17.0% |
| Immigrants | Cabo Verde | 1.6 /100 | #243 | Tragic 17.0% |
| Hondurans | 1.6 /100 | #244 | Tragic 17.0% |
| Trinidadians and Tobagonians | 1.5 /100 | #245 | Tragic 17.0% |
| Immigrants | Ireland | 1.4 /100 | #246 | Tragic 17.1% |
| Greeks | 1.3 /100 | #247 | Tragic 17.1% |
| Czechoslovakians | 1.3 /100 | #248 | Tragic 17.1% |
| Canadians | 1.3 /100 | #249 | Tragic 17.1% |
| Austrians | 1.1 /100 | #250 | Tragic 17.1% |
| Luxembourgers | 1.1 /100 | #251 | Tragic 17.1% |
| Croatians | 1.0 /100 | #252 | Tragic 17.1% |
| Cree | 1.0 /100 | #253 | Tragic 17.1% |
| Immigrants | Honduras | 0.9 /100 | #254 | Tragic 17.1% |
| Sierra Leoneans | 0.8 /100 | #255 | Tragic 17.2% |
| Immigrants | Haiti | 0.8 /100 | #256 | Tragic 17.2% |
Demographics Similar to Immigrants from Nepal by Single Father Poverty
In terms of single father poverty, the demographic groups most similar to Immigrants from Nepal are Indian (Asian) (14.8%, a difference of 0.0%), Immigrants from Eritrea (14.8%, a difference of 0.040%), Pima (14.8%, a difference of 0.17%), Immigrants from Asia (14.7%, a difference of 0.37%), and Bolivian (14.7%, a difference of 0.55%).
| Demographics | Rating | Rank | Single Father Poverty |
| Immigrants | Bolivia | 100.0 /100 | #35 | Exceptional 14.7% |
| Immigrants | Indonesia | 100.0 /100 | #36 | Exceptional 14.7% |
| Immigrants | Eastern Africa | 100.0 /100 | #37 | Exceptional 14.7% |
| Bolivians | 100.0 /100 | #38 | Exceptional 14.7% |
| Immigrants | Asia | 100.0 /100 | #39 | Exceptional 14.7% |
| Pima | 100.0 /100 | #40 | Exceptional 14.8% |
| Indians (Asian) | 100.0 /100 | #41 | Exceptional 14.8% |
| Immigrants | Nepal | 100.0 /100 | #42 | Exceptional 14.8% |
| Immigrants | Eritrea | 100.0 /100 | #43 | Exceptional 14.8% |
| Salvadorans | 100.0 /100 | #44 | Exceptional 14.9% |
| Immigrants | Somalia | 100.0 /100 | #45 | Exceptional 14.9% |
| Immigrants | Cambodia | 99.9 /100 | #46 | Exceptional 14.9% |
| Immigrants | China | 99.9 /100 | #47 | Exceptional 14.9% |
| Malaysians | 99.9 /100 | #48 | Exceptional 14.9% |
| Immigrants | Eastern Asia | 99.9 /100 | #49 | Exceptional 15.0% |