Okinawan vs Estonian Single Female Poverty
COMPARE
Okinawan
Estonian
Single Female Poverty
Single Female Poverty Comparison
Okinawans
Estonians
18.8%
SINGLE FEMALE POVERTY
99.9/ 100
METRIC RATING
40th/ 347
METRIC RANK
19.7%
SINGLE FEMALE POVERTY
98.2/ 100
METRIC RATING
95th/ 347
METRIC RANK
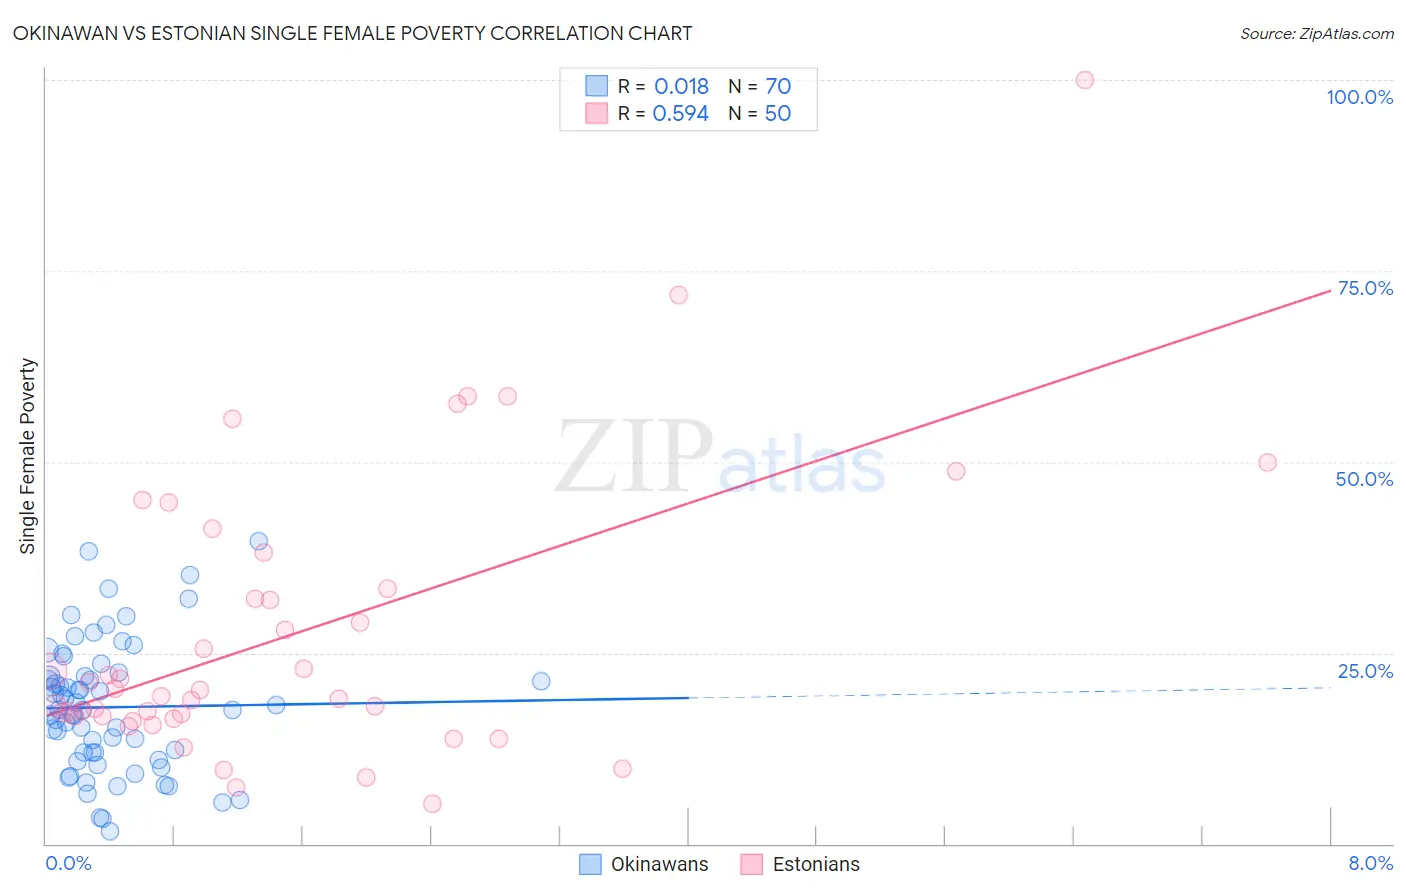
Okinawan vs Estonian Single Female Poverty Correlation Chart
The statistical analysis conducted on geographies consisting of 73,373,565 people shows no correlation between the proportion of Okinawans and poverty level among single females in the United States with a correlation coefficient (R) of 0.018 and weighted average of 18.8%. Similarly, the statistical analysis conducted on geographies consisting of 122,383,678 people shows a substantial positive correlation between the proportion of Estonians and poverty level among single females in the United States with a correlation coefficient (R) of 0.594 and weighted average of 19.7%, a difference of 4.8%.
Single Female Poverty Correlation Summary
| Measurement | Okinawan | Estonian |
| Minimum | 1.6% | 5.3% |
| Maximum | 39.6% | 100.0% |
| Range | 38.0% | 94.7% |
| Mean | 17.9% | 27.5% |
| Median | 17.5% | 19.7% |
| Interquartile 25% (IQ1) | 11.9% | 16.7% |
| Interquartile 75% (IQ3) | 21.9% | 33.3% |
| Interquartile Range (IQR) | 10.0% | 16.6% |
| Standard Deviation (Sample) | 8.4% | 18.8% |
| Standard Deviation (Population) | 8.4% | 18.6% |
Similar Demographics by Single Female Poverty
Demographics Similar to Okinawans by Single Female Poverty
In terms of single female poverty, the demographic groups most similar to Okinawans are Immigrants from Serbia (18.8%, a difference of 0.020%), Bulgarian (18.8%, a difference of 0.030%), Tongan (18.8%, a difference of 0.060%), Jordanian (18.8%, a difference of 0.090%), and Immigrants from Romania (18.8%, a difference of 0.25%).
| Demographics | Rating | Rank | Single Female Poverty |
| Immigrants | Philippines | 99.9 /100 | #33 | Exceptional 18.6% |
| Koreans | 99.9 /100 | #34 | Exceptional 18.6% |
| Immigrants | Japan | 99.9 /100 | #35 | Exceptional 18.6% |
| Turks | 99.9 /100 | #36 | Exceptional 18.7% |
| Immigrants | Armenia | 99.9 /100 | #37 | Exceptional 18.7% |
| Tongans | 99.9 /100 | #38 | Exceptional 18.8% |
| Bulgarians | 99.9 /100 | #39 | Exceptional 18.8% |
| Okinawans | 99.9 /100 | #40 | Exceptional 18.8% |
| Immigrants | Serbia | 99.9 /100 | #41 | Exceptional 18.8% |
| Jordanians | 99.9 /100 | #42 | Exceptional 18.8% |
| Immigrants | Romania | 99.9 /100 | #43 | Exceptional 18.8% |
| Immigrants | Croatia | 99.9 /100 | #44 | Exceptional 18.9% |
| Immigrants | Indonesia | 99.8 /100 | #45 | Exceptional 18.9% |
| Macedonians | 99.8 /100 | #46 | Exceptional 18.9% |
| Latvians | 99.8 /100 | #47 | Exceptional 19.0% |
Demographics Similar to Estonians by Single Female Poverty
In terms of single female poverty, the demographic groups most similar to Estonians are Immigrants from Brazil (19.7%, a difference of 0.050%), Croatian (19.7%, a difference of 0.14%), Immigrants from France (19.7%, a difference of 0.26%), Sierra Leonean (19.7%, a difference of 0.28%), and Romanian (19.6%, a difference of 0.38%).
| Demographics | Rating | Rank | Single Female Poverty |
| Afghans | 99.0 /100 | #88 | Exceptional 19.5% |
| Immigrants | Ukraine | 99.0 /100 | #89 | Exceptional 19.5% |
| Immigrants | Lebanon | 98.8 /100 | #90 | Exceptional 19.6% |
| Soviet Union | 98.8 /100 | #91 | Exceptional 19.6% |
| Italians | 98.8 /100 | #92 | Exceptional 19.6% |
| Immigrants | Austria | 98.8 /100 | #93 | Exceptional 19.6% |
| Romanians | 98.6 /100 | #94 | Exceptional 19.6% |
| Estonians | 98.2 /100 | #95 | Exceptional 19.7% |
| Immigrants | Brazil | 98.2 /100 | #96 | Exceptional 19.7% |
| Croatians | 98.1 /100 | #97 | Exceptional 19.7% |
| Immigrants | France | 97.9 /100 | #98 | Exceptional 19.7% |
| Sierra Leoneans | 97.9 /100 | #99 | Exceptional 19.7% |
| Ukrainians | 97.6 /100 | #100 | Exceptional 19.8% |
| Immigrants | Belgium | 97.3 /100 | #101 | Exceptional 19.8% |
| Immigrants | Cameroon | 97.3 /100 | #102 | Exceptional 19.8% |