Immigrants from Afghanistan vs Estonian Single Female Poverty

COMPARE

Immigrants from Afghanistan
Race
Ancestry
AfghanAfricanAlaska NativeAlaskan AthabascanAlbanianAleutAlsatianAmericanApacheArabArapahoArgentineanArmenianAssyrian/Chaldean/SyriacAustralianAustrianBahamianBangladeshiBarbadianBasqueBelgianBelizeanBermudanBhutaneseBlackfeetBolivianBrazilianBritishBritish West IndianBulgarianBurmeseCajunCambodianCanadianCape VerdeanCarpatho RusynCelticCentral AmericanCentral American IndianCherokeeCheyenneChickasawChileanChineseChippewaChoctawColombianColvilleComancheCosta RicanCreeCreekCroatianCrowCubanCypriotCzechCzechoslovakianDanishDelawareDominicanDutchDutch West IndianEastern EuropeanEcuadorianEgyptianEnglishEthiopianEuropeanFijianFilipinoFinnishFrenchFrench American IndianFrench CanadianGermanGerman RussianGhanaianGreekGuamanian/ChamorroGuatemalanGuyaneseHaitianHmongHonduranHopiHoumaHungarianIcelanderIndian (Asian)IndonesianInupiatIranianIraqiIrishIroquoisIsraeliItalianJamaicanJapaneseJordanianKenyanKiowaKoreanLaotianLatvianLebaneseLiberianLithuanianLumbeeLuxembourgerMacedonianMalaysianMalteseMarshalleseMenomineeMexicanMexican American IndianMongolianMoroccanNative HawaiianNavajoNepaleseNew ZealanderNicaraguanNigerianNorthern EuropeanNorwegianOkinawanOsageOttawaPaiutePakistaniPalestinianPanamanianParaguayanPennsylvania GermanPeruvianPimaPolishPortuguesePotawatomiPuebloPuerto RicanPuget Sound SalishRomanianRussianSalvadoranSamoanScandinavianScotch-IrishScottishSeminoleSenegaleseSerbianShoshoneSierra LeoneanSiouxSlavicSlovakSloveneSomaliSouth AfricanSouth AmericanSouth American IndianSoviet UnionSpaniardSpanishSpanish AmericanSpanish American IndianSri LankanSubsaharan AfricanSudaneseSwedishSwissSyrianTaiwaneseThaiTlingit-HaidaTohono O'OdhamTonganTrinidadian and TobagonianTsimshianTurkishU.S. Virgin IslanderUgandanUkrainianUruguayanUteVenezuelanVietnameseWelshWest IndianYakamaYaquiYugoslavianYumanYup'ikZimbabwean
Immigration
NonimmigrantsImmigrantsAfghanistanAfricaAlbaniaArgentinaArmeniaAsiaAustraliaAustriaBahamasBangladeshBarbadosBelarusBelgiumBelizeBoliviaBosnia and HerzegovinaBrazilBulgariaBurma/MyanmarCabo VerdeCambodiaCameroonCanadaCaribbeanCentral AmericaChileChinaColombiaCongoCosta RicaCroatiaCubaCzechoslovakiaDenmarkDominicaDominican RepublicEastern AfricaEastern AsiaEastern EuropeEcuadorEgyptEl SalvadorEnglandEritreaEthiopiaEuropeFijiFranceGermanyGhanaGreeceGrenadaGuatemalaGuyanaHaitiHondurasHong KongHungaryIndiaIndonesiaIranIraqIrelandIsraelItalyJamaicaJapanJordanKazakhstanKenyaKoreaKuwaitLaosLatin AmericaLatviaLebanonLiberiaLithuaniaMalaysiaMexicoMicronesiaMiddle AfricaMoldovaMoroccoNepalNetherlandsNicaraguaNigeriaNorth AmericaNorth MacedoniaNorthern AfricaNorthern EuropeNorwayOceaniaPakistanPanamaPeruPhilippinesPolandPortugalRomaniaRussiaSaudi ArabiaScotlandSenegalSerbiaSierra LeoneSingaporeSomaliaSouth AfricaSouth AmericaSouth Central AsiaSouth Eastern AsiaSouthern EuropeSpainSri LankaSt. Vincent and the GrenadinesSudanSwedenSwitzerlandSyriaTaiwanThailandTrinidad and TobagoTurkeyUgandaUkraineUruguayUzbekistanVenezuelaVietnamWest IndiesWestern AfricaWestern AsiaWestern EuropeYemenZaireZimbabweAzores
Estonian
Race
Ancestry
AfghanAfricanAlaska NativeAlaskan AthabascanAlbanianAleutAlsatianAmericanApacheArabArapahoArgentineanArmenianAssyrian/Chaldean/SyriacAustralianAustrianBahamianBangladeshiBarbadianBasqueBelgianBelizeanBermudanBhutaneseBlackfeetBolivianBrazilianBritishBritish West IndianBulgarianBurmeseCajunCambodianCanadianCape VerdeanCarpatho RusynCelticCentral AmericanCentral American IndianCherokeeCheyenneChickasawChileanChineseChippewaChoctawColombianColvilleComancheCosta RicanCreeCreekCroatianCrowCubanCypriotCzechCzechoslovakianDanishDelawareDominicanDutchDutch West IndianEastern EuropeanEcuadorianEgyptianEnglishEstonianEthiopianEuropeanFijianFilipinoFinnishFrenchFrench American IndianFrench CanadianGermanGerman RussianGhanaianGreekGuamanian/ChamorroGuatemalanGuyaneseHaitianHmongHonduranHopiHoumaHungarianIcelanderIndian (Asian)IndonesianInupiatIranianIraqiIrishIroquoisIsraeliItalianJamaicanJapaneseJordanianKenyanKiowaKoreanLaotianLatvianLebaneseLiberianLithuanianLumbeeLuxembourgerMacedonianMalaysianMalteseMarshalleseMenomineeMexicanMexican American IndianMongolianMoroccanNative HawaiianNavajoNepaleseNew ZealanderNicaraguanNigerianNorthern EuropeanNorwegianOkinawanOsageOttawaPaiutePakistaniPalestinianPanamanianParaguayanPennsylvania GermanPeruvianPimaPolishPortuguesePotawatomiPuebloPuerto RicanPuget Sound SalishRomanianRussianSalvadoranSamoanScandinavianScotch-IrishScottishSeminoleSenegaleseSerbianShoshoneSierra LeoneanSiouxSlavicSlovakSloveneSomaliSouth AfricanSouth AmericanSouth American IndianSoviet UnionSpaniardSpanishSpanish AmericanSpanish American IndianSri LankanSubsaharan AfricanSudaneseSwedishSwissSyrianTaiwaneseThaiTlingit-HaidaTohono O'OdhamTonganTrinidadian and TobagonianTsimshianTurkishU.S. Virgin IslanderUgandanUkrainianUruguayanUteVenezuelanVietnameseWelshWest IndianYakamaYaquiYugoslavianYumanYup'ikZimbabwean
Immigration
NonimmigrantsImmigrantsAfricaAlbaniaArgentinaArmeniaAsiaAustraliaAustriaBahamasBangladeshBarbadosBelarusBelgiumBelizeBoliviaBosnia and HerzegovinaBrazilBulgariaBurma/MyanmarCabo VerdeCambodiaCameroonCanadaCaribbeanCentral AmericaChileChinaColombiaCongoCosta RicaCroatiaCubaCzechoslovakiaDenmarkDominicaDominican RepublicEastern AfricaEastern AsiaEastern EuropeEcuadorEgyptEl SalvadorEnglandEritreaEthiopiaEuropeFijiFranceGermanyGhanaGreeceGrenadaGuatemalaGuyanaHaitiHondurasHong KongHungaryIndiaIndonesiaIranIraqIrelandIsraelItalyJamaicaJapanJordanKazakhstanKenyaKoreaKuwaitLaosLatin AmericaLatviaLebanonLiberiaLithuaniaMalaysiaMexicoMicronesiaMiddle AfricaMoldovaMoroccoNepalNetherlandsNicaraguaNigeriaNorth AmericaNorth MacedoniaNorthern AfricaNorthern EuropeNorwayOceaniaPakistanPanamaPeruPhilippinesPolandPortugalRomaniaRussiaSaudi ArabiaScotlandSenegalSerbiaSierra LeoneSingaporeSomaliaSouth AfricaSouth AmericaSouth Central AsiaSouth Eastern AsiaSouthern EuropeSpainSri LankaSt. Vincent and the GrenadinesSudanSwedenSwitzerlandSyriaTaiwanThailandTrinidad and TobagoTurkeyUgandaUkraineUruguayUzbekistanVenezuelaVietnamWest IndiesWestern AfricaWestern AsiaWestern EuropeYemenZaireZimbabweAzores
Single Female Poverty
Income
Poverty
Unemployment
Labor Participation
Family Structure
Vehicle Availability
Education Level
Disability

Single Female Poverty Comparison

Immigrants from Afghanistan

Estonians

Exceptional
Exceptional
20.0%
SINGLE FEMALE POVERTY
95.4/ 100
METRIC RATING
118th/ 347
METRIC RANK
19.7%
SINGLE FEMALE POVERTY
98.2/ 100
METRIC RATING
95th/ 347
METRIC RANK

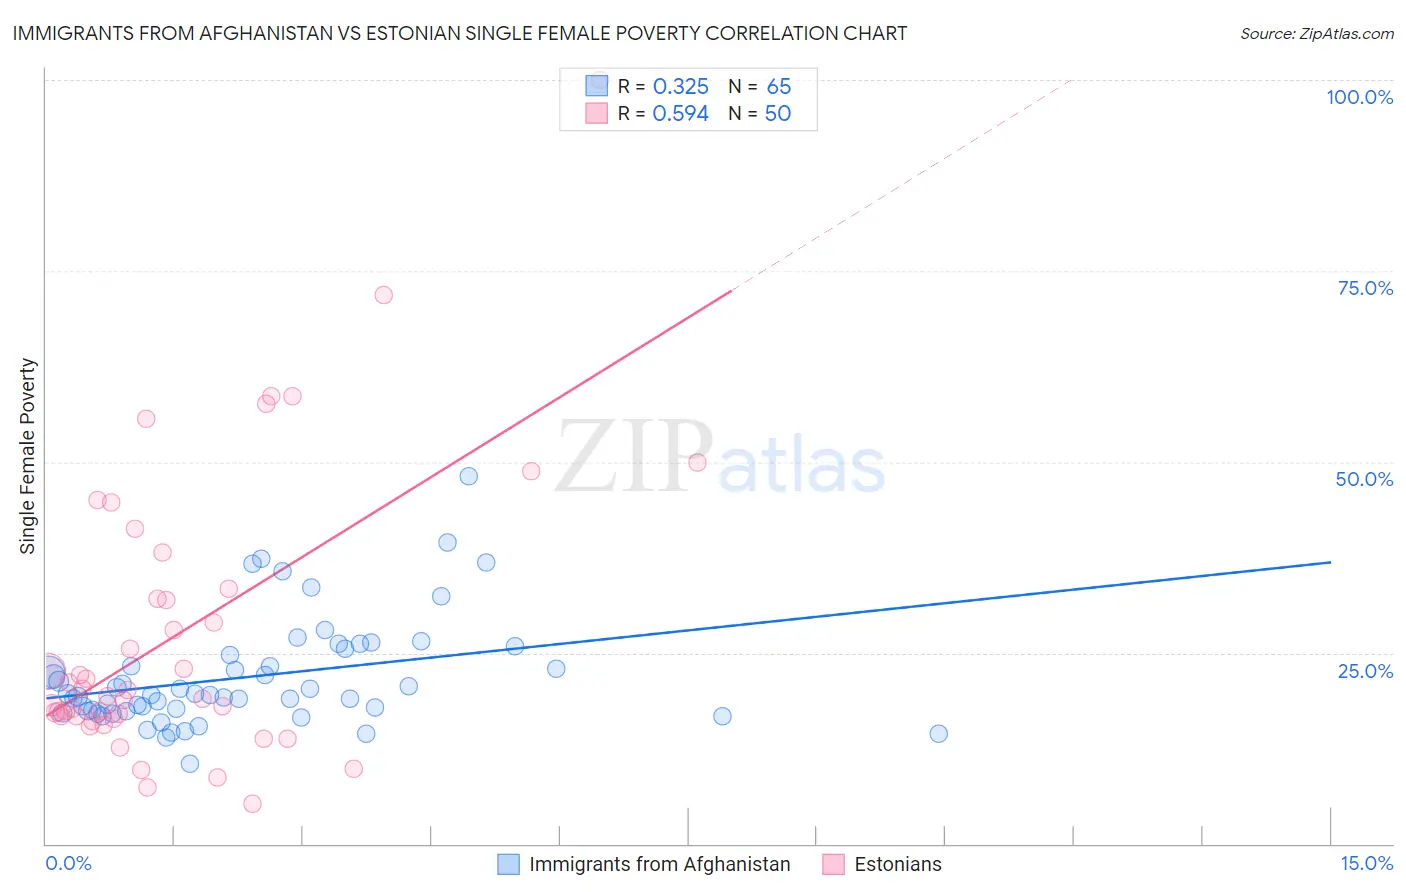
Immigrants from Afghanistan vs Estonian Single Female Poverty Correlation Chart

The statistical analysis conducted on geographies consisting of 146,836,819 people shows a mild positive correlation between the proportion of Immigrants from Afghanistan and poverty level among single females in the United States with a correlation coefficient (R) of 0.325 and weighted average of 20.0%. Similarly, the statistical analysis conducted on geographies consisting of 122,383,678 people shows a substantial positive correlation between the proportion of Estonians and poverty level among single females in the United States with a correlation coefficient (R) of 0.594 and weighted average of 19.7%, a difference of 1.6%.
Immigrants from Afghanistan vs Estonian Single Female Poverty

Single Female Poverty Correlation Summary

MeasurementImmigrants from AfghanistanEstonian
Minimum10.5%5.3%
Maximum48.1%100.0%
Range37.7%94.7%
Mean21.8%27.5%
Median19.5%19.7%
Interquartile 25% (IQ1)17.3%16.7%
Interquartile 75% (IQ3)25.1%33.3%
Interquartile Range (IQR)7.8%16.6%
Standard Deviation (Sample)7.1%18.8%
Standard Deviation (Population)7.0%18.6%

Similar Demographics by Single Female Poverty

Demographics Similar to Immigrants from Afghanistan by Single Female Poverty

In terms of single female poverty, the demographic groups most similar to Immigrants from Afghanistan are Immigrants from Ethiopia (20.0%, a difference of 0.0%), Polish (20.0%, a difference of 0.080%), South American (20.0%, a difference of 0.10%), Immigrants from Kazakhstan (20.0%, a difference of 0.12%), and Immigrants from Switzerland (20.0%, a difference of 0.13%).
DemographicsRating | RankSingle Female Poverty
Carpatho Rusyns
96.1
/100
|
#111
Exceptional
20.0%
Immigrants | Netherlands
96.0
/100
|
#112
Exceptional
20.0%
Immigrants | Zimbabwe
95.9
/100
|
#113
Exceptional
20.0%
Immigrants | Colombia
95.9
/100
|
#114
Exceptional
20.0%
Immigrants | Northern Africa
95.8
/100
|
#115
Exceptional
20.0%
Immigrants | Kazakhstan
95.7
/100
|
#116
Exceptional
20.0%
Poles
95.6
/100
|
#117
Exceptional
20.0%
Immigrants | Afghanistan
95.4
/100
|
#118
Exceptional
20.0%
Immigrants | Ethiopia
95.4
/100
|
#119
Exceptional
20.0%
South Americans
95.1
/100
|
#120
Exceptional
20.0%
Immigrants | Switzerland
95.1
/100
|
#121
Exceptional
20.0%
Immigrants | South America
95.0
/100
|
#122
Exceptional
20.0%
Brazilians
94.4
/100
|
#123
Exceptional
20.1%
Immigrants | Chile
94.3
/100
|
#124
Exceptional
20.1%
Immigrants | South Africa
93.9
/100
|
#125
Exceptional
20.1%

Demographics Similar to Estonians by Single Female Poverty

In terms of single female poverty, the demographic groups most similar to Estonians are Immigrants from Brazil (19.7%, a difference of 0.050%), Croatian (19.7%, a difference of 0.14%), Immigrants from France (19.7%, a difference of 0.26%), Sierra Leonean (19.7%, a difference of 0.28%), and Romanian (19.6%, a difference of 0.38%).
DemographicsRating | RankSingle Female Poverty
Afghans
99.0
/100
|
#88
Exceptional
19.5%
Immigrants | Ukraine
99.0
/100
|
#89
Exceptional
19.5%
Immigrants | Lebanon
98.8
/100
|
#90
Exceptional
19.6%
Soviet Union
98.8
/100
|
#91
Exceptional
19.6%
Italians
98.8
/100
|
#92
Exceptional
19.6%
Immigrants | Austria
98.8
/100
|
#93
Exceptional
19.6%
Romanians
98.6
/100
|
#94
Exceptional
19.6%
Estonians
98.2
/100
|
#95
Exceptional
19.7%
Immigrants | Brazil
98.2
/100
|
#96
Exceptional
19.7%
Croatians
98.1
/100
|
#97
Exceptional
19.7%
Immigrants | France
97.9
/100
|
#98
Exceptional
19.7%
Sierra Leoneans
97.9
/100
|
#99
Exceptional
19.7%
Ukrainians
97.6
/100
|
#100
Exceptional
19.8%
Immigrants | Belgium
97.3
/100
|
#101
Exceptional
19.8%
Immigrants | Cameroon
97.3
/100
|
#102
Exceptional
19.8%