Tohono O'odham vs Potawatomi Single Female Poverty
COMPARE
Tohono O'odham
Potawatomi
Single Female Poverty
Single Female Poverty Comparison
Tohono O'odham
Potawatomi
34.2%
SINGLE FEMALE POVERTY
0.0/ 100
METRIC RATING
347th/ 347
METRIC RANK
25.4%
SINGLE FEMALE POVERTY
0.0/ 100
METRIC RATING
307th/ 347
METRIC RANK
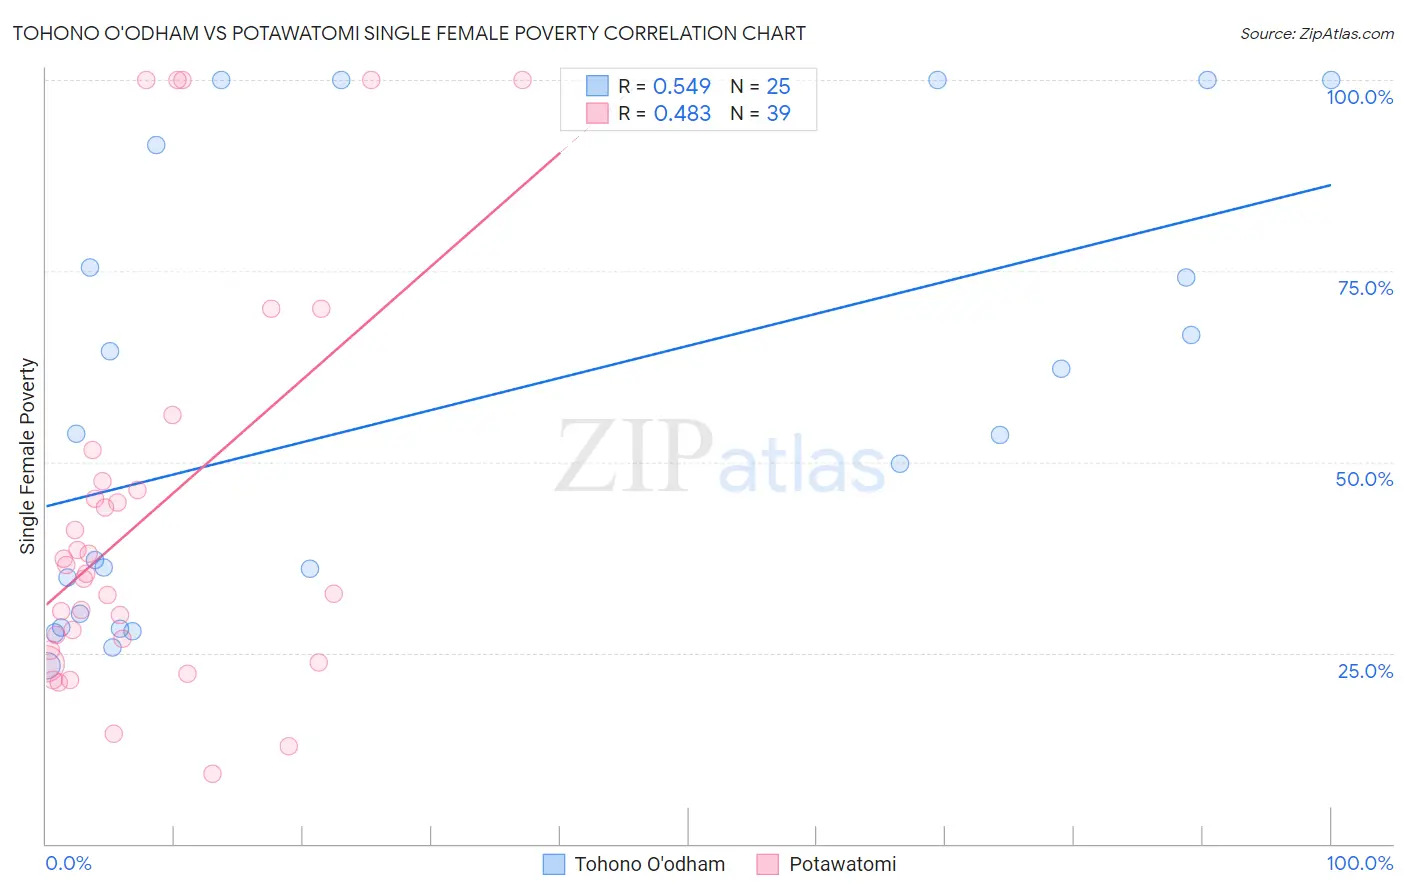
Tohono O'odham vs Potawatomi Single Female Poverty Correlation Chart
The statistical analysis conducted on geographies consisting of 58,585,970 people shows a substantial positive correlation between the proportion of Tohono O'odham and poverty level among single females in the United States with a correlation coefficient (R) of 0.549 and weighted average of 34.2%. Similarly, the statistical analysis conducted on geographies consisting of 117,128,291 people shows a moderate positive correlation between the proportion of Potawatomi and poverty level among single females in the United States with a correlation coefficient (R) of 0.483 and weighted average of 25.4%, a difference of 34.8%.
Single Female Poverty Correlation Summary
| Measurement | Tohono O'odham | Potawatomi |
| Minimum | 23.3% | 9.1% |
| Maximum | 100.0% | 100.0% |
| Range | 76.7% | 90.9% |
| Mean | 57.1% | 42.8% |
| Median | 53.5% | 35.3% |
| Interquartile 25% (IQ1) | 29.2% | 25.3% |
| Interquartile 75% (IQ3) | 83.5% | 47.5% |
| Interquartile Range (IQR) | 54.3% | 22.2% |
| Standard Deviation (Sample) | 28.4% | 25.9% |
| Standard Deviation (Population) | 27.8% | 25.5% |
Similar Demographics by Single Female Poverty
Demographics Similar to Tohono O'odham by Single Female Poverty
In terms of single female poverty, the demographic groups most similar to Tohono O'odham are Puerto Rican (34.1%, a difference of 0.30%), Houma (33.8%, a difference of 1.2%), Lumbee (33.0%, a difference of 3.6%), Crow (32.4%, a difference of 5.5%), and Navajo (31.7%, a difference of 8.1%).
| Demographics | Rating | Rank | Single Female Poverty |
| Ute | 0.0 /100 | #333 | Tragic 28.4% |
| Pueblo | 0.0 /100 | #334 | Tragic 28.6% |
| Immigrants | Yemen | 0.0 /100 | #335 | Tragic 28.9% |
| Colville | 0.0 /100 | #336 | Tragic 29.1% |
| Yuman | 0.0 /100 | #337 | Tragic 29.4% |
| Pima | 0.0 /100 | #338 | Tragic 30.3% |
| Cheyenne | 0.0 /100 | #339 | Tragic 30.4% |
| Cajuns | 0.0 /100 | #340 | Tragic 30.6% |
| Sioux | 0.0 /100 | #341 | Tragic 31.3% |
| Navajo | 0.0 /100 | #342 | Tragic 31.7% |
| Crow | 0.0 /100 | #343 | Tragic 32.4% |
| Lumbee | 0.0 /100 | #344 | Tragic 33.0% |
| Houma | 0.0 /100 | #345 | Tragic 33.8% |
| Puerto Ricans | 0.0 /100 | #346 | Tragic 34.1% |
| Tohono O'odham | 0.0 /100 | #347 | Tragic 34.2% |
Demographics Similar to Potawatomi by Single Female Poverty
In terms of single female poverty, the demographic groups most similar to Potawatomi are Aleut (25.4%, a difference of 0.17%), Dominican (25.4%, a difference of 0.18%), Immigrants from Mexico (25.3%, a difference of 0.23%), Immigrants from Dominican Republic (25.3%, a difference of 0.32%), and Central American Indian (25.5%, a difference of 0.33%).
| Demographics | Rating | Rank | Single Female Poverty |
| Blackfeet | 0.0 /100 | #300 | Tragic 25.1% |
| Hondurans | 0.0 /100 | #301 | Tragic 25.1% |
| Shoshone | 0.0 /100 | #302 | Tragic 25.1% |
| Somalis | 0.0 /100 | #303 | Tragic 25.2% |
| Immigrants | Congo | 0.0 /100 | #304 | Tragic 25.3% |
| Immigrants | Dominican Republic | 0.0 /100 | #305 | Tragic 25.3% |
| Immigrants | Mexico | 0.0 /100 | #306 | Tragic 25.3% |
| Potawatomi | 0.0 /100 | #307 | Tragic 25.4% |
| Aleuts | 0.0 /100 | #308 | Tragic 25.4% |
| Dominicans | 0.0 /100 | #309 | Tragic 25.4% |
| Central American Indians | 0.0 /100 | #310 | Tragic 25.5% |
| Immigrants | Honduras | 0.0 /100 | #311 | Tragic 25.5% |
| Paiute | 0.0 /100 | #312 | Tragic 25.5% |
| Comanche | 0.0 /100 | #313 | Tragic 25.6% |
| Cherokee | 0.0 /100 | #314 | Tragic 25.7% |