Tohono O'odham vs Honduran Single Female Poverty
COMPARE
Tohono O'odham
Honduran
Single Female Poverty
Single Female Poverty Comparison
Tohono O'odham
Hondurans
34.2%
SINGLE FEMALE POVERTY
0.0/ 100
METRIC RATING
347th/ 347
METRIC RANK
25.1%
SINGLE FEMALE POVERTY
0.0/ 100
METRIC RATING
301st/ 347
METRIC RANK
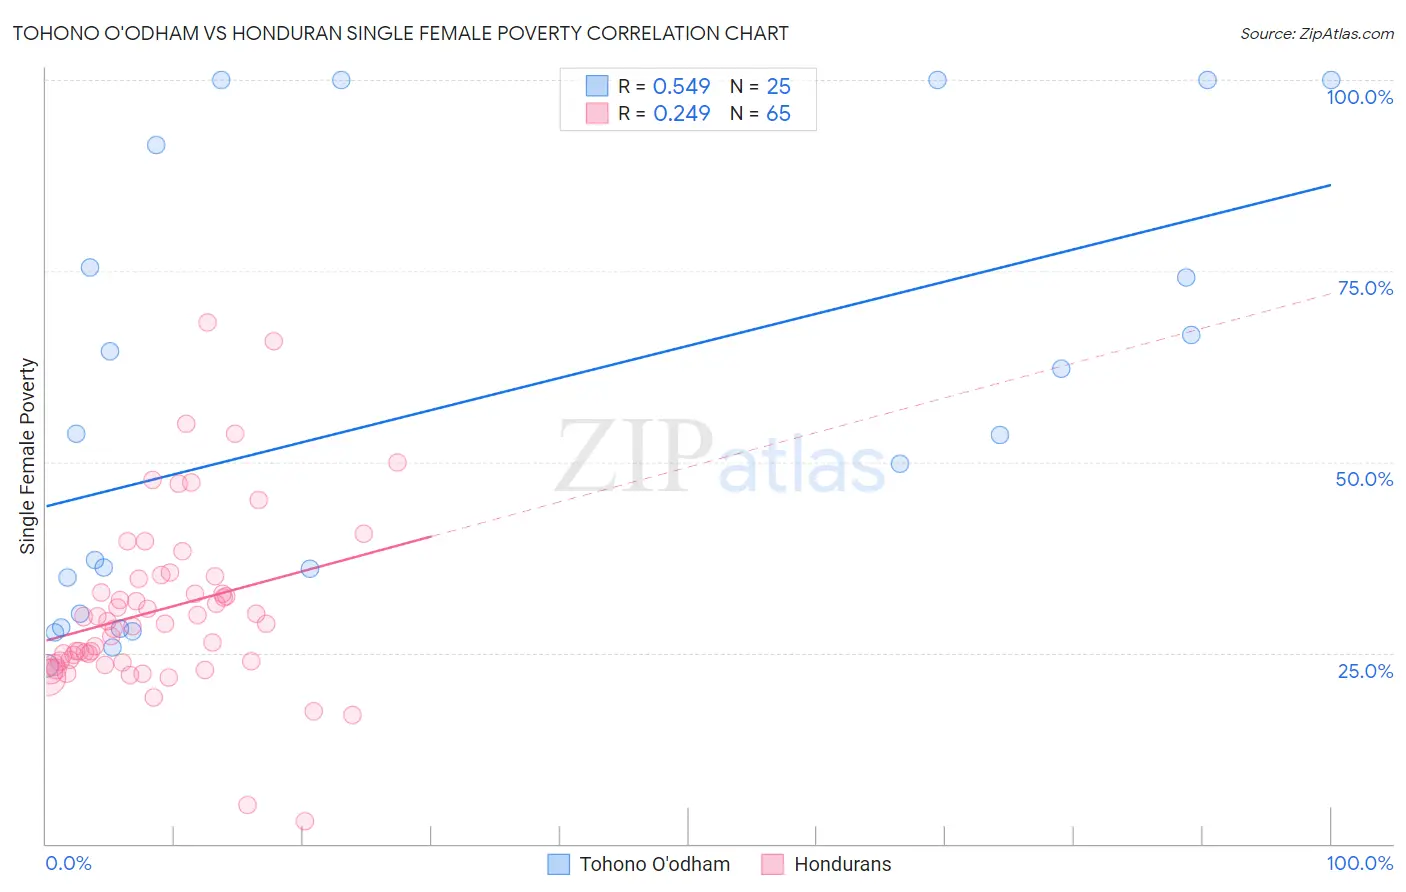
Tohono O'odham vs Honduran Single Female Poverty Correlation Chart
The statistical analysis conducted on geographies consisting of 58,585,970 people shows a substantial positive correlation between the proportion of Tohono O'odham and poverty level among single females in the United States with a correlation coefficient (R) of 0.549 and weighted average of 34.2%. Similarly, the statistical analysis conducted on geographies consisting of 354,754,258 people shows a weak positive correlation between the proportion of Hondurans and poverty level among single females in the United States with a correlation coefficient (R) of 0.249 and weighted average of 25.1%, a difference of 36.3%.
Single Female Poverty Correlation Summary
| Measurement | Tohono O'odham | Honduran |
| Minimum | 23.3% | 3.0% |
| Maximum | 100.0% | 68.3% |
| Range | 76.7% | 65.3% |
| Mean | 57.1% | 30.7% |
| Median | 53.5% | 28.8% |
| Interquartile 25% (IQ1) | 29.2% | 23.8% |
| Interquartile 75% (IQ3) | 83.5% | 34.8% |
| Interquartile Range (IQR) | 54.3% | 11.0% |
| Standard Deviation (Sample) | 28.4% | 11.6% |
| Standard Deviation (Population) | 27.8% | 11.6% |
Similar Demographics by Single Female Poverty
Demographics Similar to Tohono O'odham by Single Female Poverty
In terms of single female poverty, the demographic groups most similar to Tohono O'odham are Puerto Rican (34.1%, a difference of 0.30%), Houma (33.8%, a difference of 1.2%), Lumbee (33.0%, a difference of 3.6%), Crow (32.4%, a difference of 5.5%), and Navajo (31.7%, a difference of 8.1%).
| Demographics | Rating | Rank | Single Female Poverty |
| Ute | 0.0 /100 | #333 | Tragic 28.4% |
| Pueblo | 0.0 /100 | #334 | Tragic 28.6% |
| Immigrants | Yemen | 0.0 /100 | #335 | Tragic 28.9% |
| Colville | 0.0 /100 | #336 | Tragic 29.1% |
| Yuman | 0.0 /100 | #337 | Tragic 29.4% |
| Pima | 0.0 /100 | #338 | Tragic 30.3% |
| Cheyenne | 0.0 /100 | #339 | Tragic 30.4% |
| Cajuns | 0.0 /100 | #340 | Tragic 30.6% |
| Sioux | 0.0 /100 | #341 | Tragic 31.3% |
| Navajo | 0.0 /100 | #342 | Tragic 31.7% |
| Crow | 0.0 /100 | #343 | Tragic 32.4% |
| Lumbee | 0.0 /100 | #344 | Tragic 33.0% |
| Houma | 0.0 /100 | #345 | Tragic 33.8% |
| Puerto Ricans | 0.0 /100 | #346 | Tragic 34.1% |
| Tohono O'odham | 0.0 /100 | #347 | Tragic 34.2% |
Demographics Similar to Hondurans by Single Female Poverty
In terms of single female poverty, the demographic groups most similar to Hondurans are Shoshone (25.1%, a difference of 0.090%), Blackfeet (25.1%, a difference of 0.18%), Mexican (25.0%, a difference of 0.25%), Somali (25.2%, a difference of 0.48%), and Immigrants from Congo (25.3%, a difference of 0.75%).
| Demographics | Rating | Rank | Single Female Poverty |
| French American Indians | 0.0 /100 | #294 | Tragic 24.6% |
| Hispanics or Latinos | 0.0 /100 | #295 | Tragic 24.6% |
| Africans | 0.0 /100 | #296 | Tragic 24.8% |
| Immigrants | Central America | 0.0 /100 | #297 | Tragic 24.8% |
| Yaqui | 0.0 /100 | #298 | Tragic 24.9% |
| Mexicans | 0.0 /100 | #299 | Tragic 25.0% |
| Blackfeet | 0.0 /100 | #300 | Tragic 25.1% |
| Hondurans | 0.0 /100 | #301 | Tragic 25.1% |
| Shoshone | 0.0 /100 | #302 | Tragic 25.1% |
| Somalis | 0.0 /100 | #303 | Tragic 25.2% |
| Immigrants | Congo | 0.0 /100 | #304 | Tragic 25.3% |
| Immigrants | Dominican Republic | 0.0 /100 | #305 | Tragic 25.3% |
| Immigrants | Mexico | 0.0 /100 | #306 | Tragic 25.3% |
| Potawatomi | 0.0 /100 | #307 | Tragic 25.4% |
| Aleuts | 0.0 /100 | #308 | Tragic 25.4% |