Tohono O'odham vs Canadian Single Female Poverty
COMPARE
Tohono O'odham
Canadian
Single Female Poverty
Single Female Poverty Comparison
Tohono O'odham
Canadians
34.2%
SINGLE FEMALE POVERTY
0.0/ 100
METRIC RATING
347th/ 347
METRIC RANK
21.1%
SINGLE FEMALE POVERTY
45.4/ 100
METRIC RATING
176th/ 347
METRIC RANK
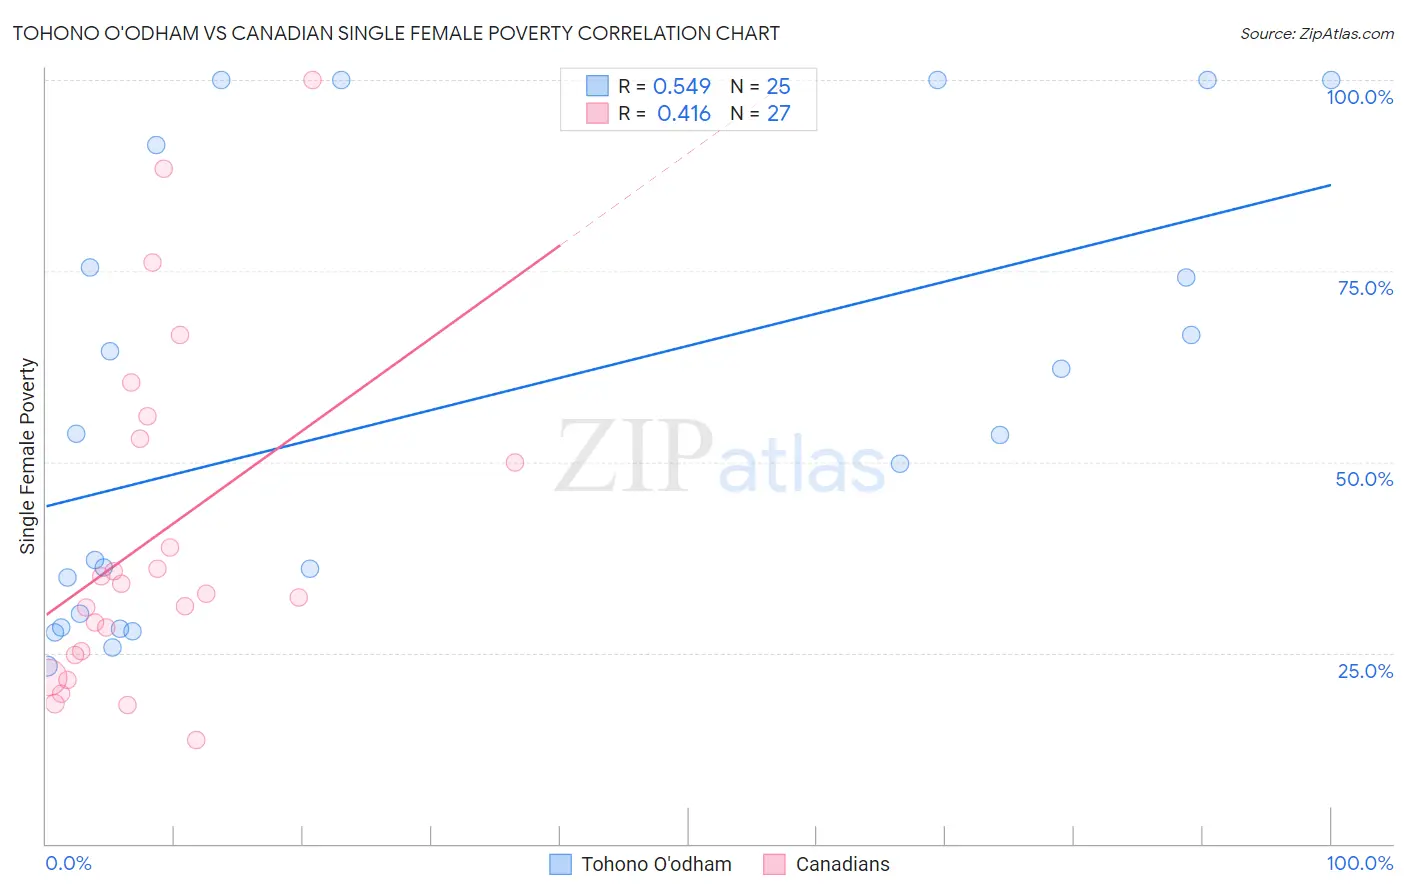
Tohono O'odham vs Canadian Single Female Poverty Correlation Chart
The statistical analysis conducted on geographies consisting of 58,585,970 people shows a substantial positive correlation between the proportion of Tohono O'odham and poverty level among single females in the United States with a correlation coefficient (R) of 0.549 and weighted average of 34.2%. Similarly, the statistical analysis conducted on geographies consisting of 428,352,495 people shows a moderate positive correlation between the proportion of Canadians and poverty level among single females in the United States with a correlation coefficient (R) of 0.416 and weighted average of 21.1%, a difference of 62.4%.
Single Female Poverty Correlation Summary
| Measurement | Tohono O'odham | Canadian |
| Minimum | 23.3% | 13.6% |
| Maximum | 100.0% | 100.0% |
| Range | 76.7% | 86.4% |
| Mean | 57.1% | 39.9% |
| Median | 53.5% | 32.8% |
| Interquartile 25% (IQ1) | 29.2% | 24.7% |
| Interquartile 75% (IQ3) | 83.5% | 53.0% |
| Interquartile Range (IQR) | 54.3% | 28.3% |
| Standard Deviation (Sample) | 28.4% | 22.1% |
| Standard Deviation (Population) | 27.8% | 21.7% |
Similar Demographics by Single Female Poverty
Demographics Similar to Tohono O'odham by Single Female Poverty
In terms of single female poverty, the demographic groups most similar to Tohono O'odham are Puerto Rican (34.1%, a difference of 0.30%), Houma (33.8%, a difference of 1.2%), Lumbee (33.0%, a difference of 3.6%), Crow (32.4%, a difference of 5.5%), and Navajo (31.7%, a difference of 8.1%).
| Demographics | Rating | Rank | Single Female Poverty |
| Ute | 0.0 /100 | #333 | Tragic 28.4% |
| Pueblo | 0.0 /100 | #334 | Tragic 28.6% |
| Immigrants | Yemen | 0.0 /100 | #335 | Tragic 28.9% |
| Colville | 0.0 /100 | #336 | Tragic 29.1% |
| Yuman | 0.0 /100 | #337 | Tragic 29.4% |
| Pima | 0.0 /100 | #338 | Tragic 30.3% |
| Cheyenne | 0.0 /100 | #339 | Tragic 30.4% |
| Cajuns | 0.0 /100 | #340 | Tragic 30.6% |
| Sioux | 0.0 /100 | #341 | Tragic 31.3% |
| Navajo | 0.0 /100 | #342 | Tragic 31.7% |
| Crow | 0.0 /100 | #343 | Tragic 32.4% |
| Lumbee | 0.0 /100 | #344 | Tragic 33.0% |
| Houma | 0.0 /100 | #345 | Tragic 33.8% |
| Puerto Ricans | 0.0 /100 | #346 | Tragic 34.1% |
| Tohono O'odham | 0.0 /100 | #347 | Tragic 34.2% |
Demographics Similar to Canadians by Single Female Poverty
In terms of single female poverty, the demographic groups most similar to Canadians are Scandinavian (21.1%, a difference of 0.010%), Immigrants from Bosnia and Herzegovina (21.1%, a difference of 0.040%), Czech (21.0%, a difference of 0.080%), British (21.1%, a difference of 0.16%), and Spanish American Indian (21.1%, a difference of 0.19%).
| Demographics | Rating | Rank | Single Female Poverty |
| Immigrants | Trinidad and Tobago | 56.3 /100 | #169 | Average 20.9% |
| New Zealanders | 53.2 /100 | #170 | Average 21.0% |
| Moroccans | 52.8 /100 | #171 | Average 21.0% |
| Guyanese | 52.0 /100 | #172 | Average 21.0% |
| Immigrants | Guyana | 50.6 /100 | #173 | Average 21.0% |
| Cubans | 50.0 /100 | #174 | Average 21.0% |
| Czechs | 46.8 /100 | #175 | Average 21.0% |
| Canadians | 45.4 /100 | #176 | Average 21.1% |
| Scandinavians | 45.2 /100 | #177 | Average 21.1% |
| Immigrants | Bosnia and Herzegovina | 44.9 /100 | #178 | Average 21.1% |
| British | 42.9 /100 | #179 | Average 21.1% |
| Spanish American Indians | 42.5 /100 | #180 | Average 21.1% |
| Europeans | 42.3 /100 | #181 | Average 21.1% |
| Slavs | 40.5 /100 | #182 | Average 21.1% |
| Slovaks | 39.7 /100 | #183 | Fair 21.1% |