Colombian vs Potawatomi Single Female Poverty
COMPARE
Colombian
Potawatomi
Single Female Poverty
Single Female Poverty Comparison
Colombians
Potawatomi
19.9%
SINGLE FEMALE POVERTY
96.6/ 100
METRIC RATING
109th/ 347
METRIC RANK
25.4%
SINGLE FEMALE POVERTY
0.0/ 100
METRIC RATING
307th/ 347
METRIC RANK
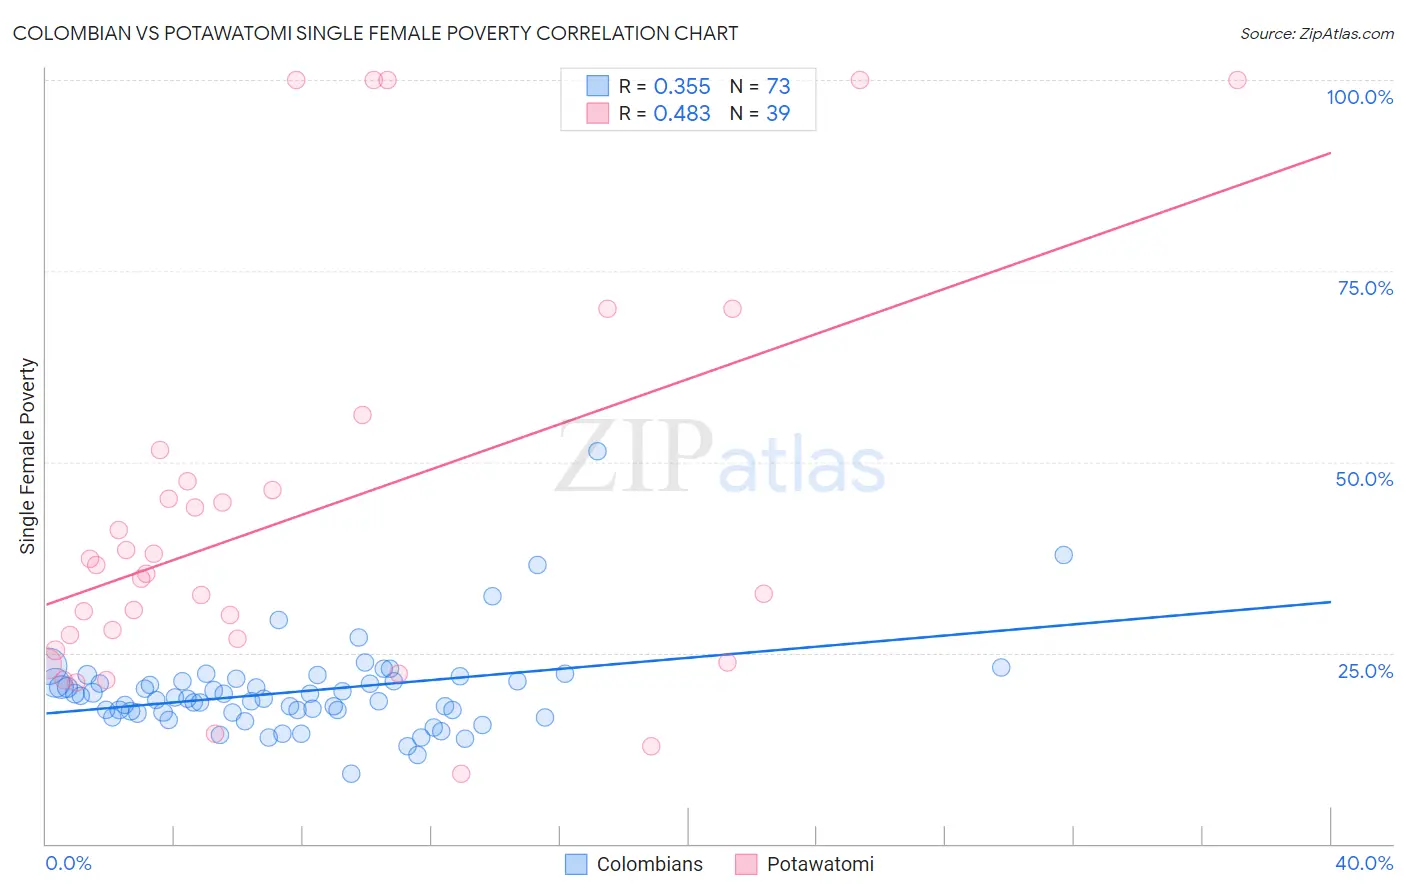
Colombian vs Potawatomi Single Female Poverty Correlation Chart
The statistical analysis conducted on geographies consisting of 412,800,850 people shows a mild positive correlation between the proportion of Colombians and poverty level among single females in the United States with a correlation coefficient (R) of 0.355 and weighted average of 19.9%. Similarly, the statistical analysis conducted on geographies consisting of 117,128,291 people shows a moderate positive correlation between the proportion of Potawatomi and poverty level among single females in the United States with a correlation coefficient (R) of 0.483 and weighted average of 25.4%, a difference of 27.4%.
Single Female Poverty Correlation Summary
| Measurement | Colombian | Potawatomi |
| Minimum | 9.2% | 9.1% |
| Maximum | 51.3% | 100.0% |
| Range | 42.2% | 90.9% |
| Mean | 19.9% | 42.8% |
| Median | 19.0% | 35.3% |
| Interquartile 25% (IQ1) | 17.2% | 25.3% |
| Interquartile 75% (IQ3) | 21.3% | 47.5% |
| Interquartile Range (IQR) | 4.1% | 22.2% |
| Standard Deviation (Sample) | 6.0% | 25.9% |
| Standard Deviation (Population) | 6.0% | 25.5% |
Similar Demographics by Single Female Poverty
Demographics Similar to Colombians by Single Female Poverty
In terms of single female poverty, the demographic groups most similar to Colombians are Native Hawaiian (19.9%, a difference of 0.0%), Immigrants from Western Asia (19.9%, a difference of 0.010%), Immigrants from Syria (19.9%, a difference of 0.060%), Ethiopian (19.9%, a difference of 0.070%), and Israeli (19.9%, a difference of 0.17%).
| Demographics | Rating | Rank | Single Female Poverty |
| Immigrants | Cameroon | 97.3 /100 | #102 | Exceptional 19.8% |
| Immigrants | Southern Europe | 97.1 /100 | #103 | Exceptional 19.9% |
| Chileans | 96.9 /100 | #104 | Exceptional 19.9% |
| Israelis | 96.9 /100 | #105 | Exceptional 19.9% |
| Ethiopians | 96.7 /100 | #106 | Exceptional 19.9% |
| Immigrants | Syria | 96.7 /100 | #107 | Exceptional 19.9% |
| Native Hawaiians | 96.6 /100 | #108 | Exceptional 19.9% |
| Colombians | 96.6 /100 | #109 | Exceptional 19.9% |
| Immigrants | Western Asia | 96.5 /100 | #110 | Exceptional 19.9% |
| Carpatho Rusyns | 96.1 /100 | #111 | Exceptional 20.0% |
| Immigrants | Netherlands | 96.0 /100 | #112 | Exceptional 20.0% |
| Immigrants | Zimbabwe | 95.9 /100 | #113 | Exceptional 20.0% |
| Immigrants | Colombia | 95.9 /100 | #114 | Exceptional 20.0% |
| Immigrants | Northern Africa | 95.8 /100 | #115 | Exceptional 20.0% |
| Immigrants | Kazakhstan | 95.7 /100 | #116 | Exceptional 20.0% |
Demographics Similar to Potawatomi by Single Female Poverty
In terms of single female poverty, the demographic groups most similar to Potawatomi are Aleut (25.4%, a difference of 0.17%), Dominican (25.4%, a difference of 0.18%), Immigrants from Mexico (25.3%, a difference of 0.23%), Immigrants from Dominican Republic (25.3%, a difference of 0.32%), and Central American Indian (25.5%, a difference of 0.33%).
| Demographics | Rating | Rank | Single Female Poverty |
| Blackfeet | 0.0 /100 | #300 | Tragic 25.1% |
| Hondurans | 0.0 /100 | #301 | Tragic 25.1% |
| Shoshone | 0.0 /100 | #302 | Tragic 25.1% |
| Somalis | 0.0 /100 | #303 | Tragic 25.2% |
| Immigrants | Congo | 0.0 /100 | #304 | Tragic 25.3% |
| Immigrants | Dominican Republic | 0.0 /100 | #305 | Tragic 25.3% |
| Immigrants | Mexico | 0.0 /100 | #306 | Tragic 25.3% |
| Potawatomi | 0.0 /100 | #307 | Tragic 25.4% |
| Aleuts | 0.0 /100 | #308 | Tragic 25.4% |
| Dominicans | 0.0 /100 | #309 | Tragic 25.4% |
| Central American Indians | 0.0 /100 | #310 | Tragic 25.5% |
| Immigrants | Honduras | 0.0 /100 | #311 | Tragic 25.5% |
| Paiute | 0.0 /100 | #312 | Tragic 25.5% |
| Comanche | 0.0 /100 | #313 | Tragic 25.6% |
| Cherokee | 0.0 /100 | #314 | Tragic 25.7% |