Ecuadorian vs Immigrants from Micronesia Family Poverty
COMPARE
Ecuadorian
Immigrants from Micronesia
Family Poverty
Family Poverty Comparison
Ecuadorians
Immigrants from Micronesia
10.8%
FAMILY POVERTY
0.2/ 100
METRIC RATING
254th/ 347
METRIC RANK
9.8%
FAMILY POVERTY
6.7/ 100
METRIC RATING
214th/ 347
METRIC RANK
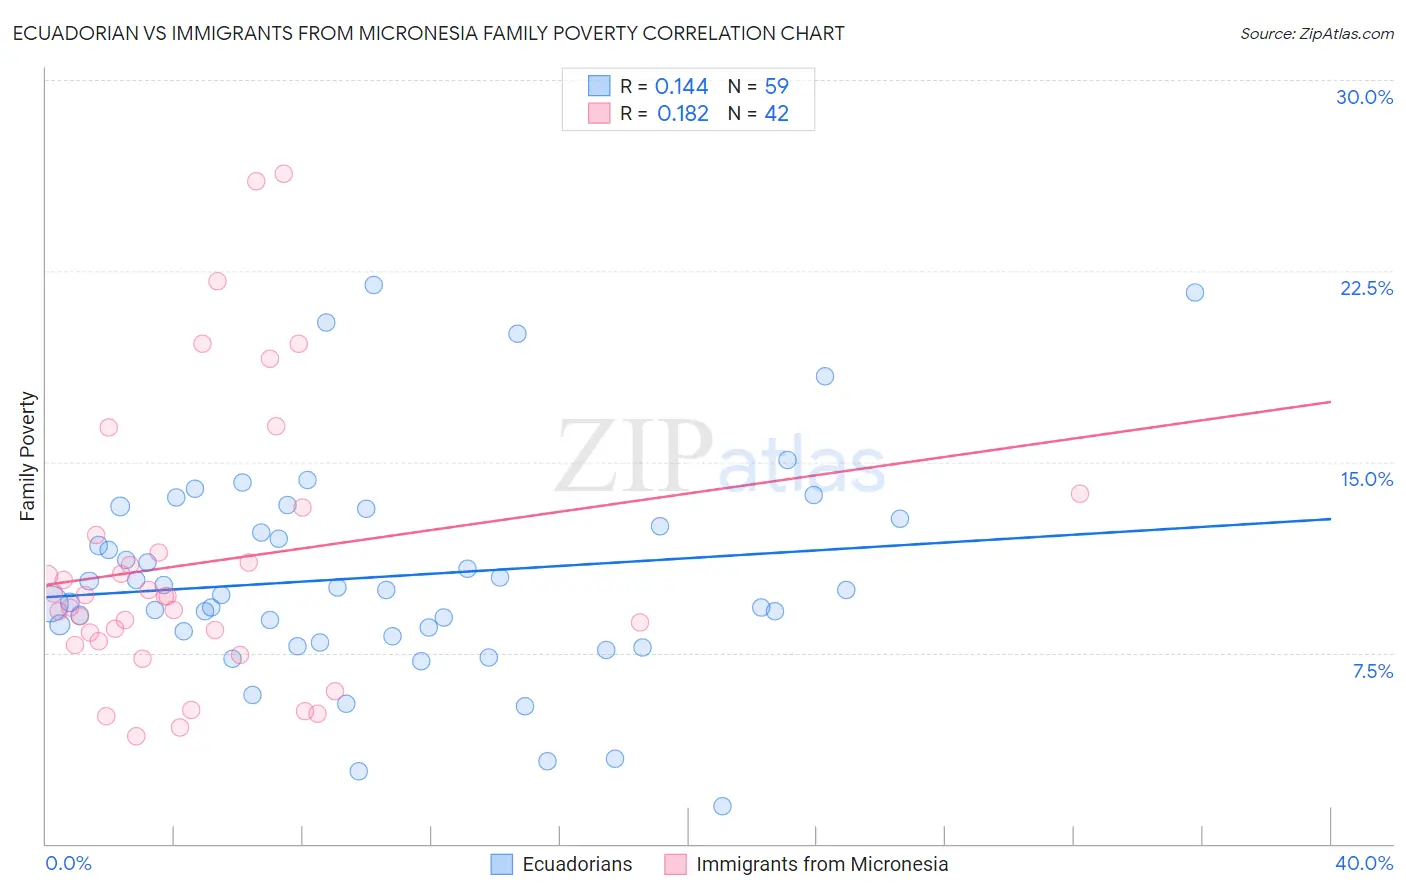
Ecuadorian vs Immigrants from Micronesia Family Poverty Correlation Chart
The statistical analysis conducted on geographies consisting of 317,108,203 people shows a poor positive correlation between the proportion of Ecuadorians and poverty level among families in the United States with a correlation coefficient (R) of 0.144 and weighted average of 10.8%. Similarly, the statistical analysis conducted on geographies consisting of 61,589,197 people shows a poor positive correlation between the proportion of Immigrants from Micronesia and poverty level among families in the United States with a correlation coefficient (R) of 0.182 and weighted average of 9.8%, a difference of 10.2%.
Family Poverty Correlation Summary
| Measurement | Ecuadorian | Immigrants from Micronesia |
| Minimum | 1.5% | 4.2% |
| Maximum | 21.9% | 26.3% |
| Range | 20.5% | 22.1% |
| Mean | 10.5% | 11.0% |
| Median | 10.0% | 9.7% |
| Interquartile 25% (IQ1) | 8.1% | 7.9% |
| Interquartile 75% (IQ3) | 12.8% | 12.1% |
| Interquartile Range (IQR) | 4.6% | 4.2% |
| Standard Deviation (Sample) | 4.2% | 5.5% |
| Standard Deviation (Population) | 4.2% | 5.4% |
Similar Demographics by Family Poverty
Demographics Similar to Ecuadorians by Family Poverty
In terms of family poverty, the demographic groups most similar to Ecuadorians are Immigrants from Western Africa (10.7%, a difference of 0.30%), Immigrants from Liberia (10.8%, a difference of 0.37%), Immigrants from Zaire (10.7%, a difference of 0.41%), Iroquois (10.7%, a difference of 0.53%), and Chickasaw (10.8%, a difference of 0.64%).
| Demographics | Rating | Rank | Family Poverty |
| Liberians | 0.4 /100 | #247 | Tragic 10.6% |
| Nicaraguans | 0.4 /100 | #248 | Tragic 10.6% |
| Cubans | 0.4 /100 | #249 | Tragic 10.6% |
| Salvadorans | 0.3 /100 | #250 | Tragic 10.7% |
| Iroquois | 0.3 /100 | #251 | Tragic 10.7% |
| Immigrants | Zaire | 0.3 /100 | #252 | Tragic 10.7% |
| Immigrants | Western Africa | 0.3 /100 | #253 | Tragic 10.7% |
| Ecuadorians | 0.2 /100 | #254 | Tragic 10.8% |
| Immigrants | Liberia | 0.2 /100 | #255 | Tragic 10.8% |
| Chickasaw | 0.2 /100 | #256 | Tragic 10.8% |
| Immigrants | Ghana | 0.2 /100 | #257 | Tragic 10.8% |
| Sub-Saharan Africans | 0.2 /100 | #258 | Tragic 10.9% |
| Mexican American Indians | 0.2 /100 | #259 | Tragic 10.9% |
| Bangladeshis | 0.2 /100 | #260 | Tragic 10.9% |
| Shoshone | 0.2 /100 | #261 | Tragic 10.9% |
Demographics Similar to Immigrants from Micronesia by Family Poverty
In terms of family poverty, the demographic groups most similar to Immigrants from Micronesia are Nonimmigrants (9.8%, a difference of 0.030%), Moroccan (9.8%, a difference of 0.090%), American (9.8%, a difference of 0.29%), Osage (9.7%, a difference of 0.58%), and Panamanian (9.8%, a difference of 0.61%).
| Demographics | Rating | Rank | Family Poverty |
| Sierra Leoneans | 15.6 /100 | #207 | Poor 9.5% |
| Immigrants | Eastern Africa | 15.1 /100 | #208 | Poor 9.5% |
| Immigrants | Uruguay | 14.0 /100 | #209 | Poor 9.5% |
| Alsatians | 11.3 /100 | #210 | Poor 9.6% |
| Malaysians | 10.6 /100 | #211 | Poor 9.6% |
| Immigrants | Thailand | 9.7 /100 | #212 | Tragic 9.7% |
| Osage | 8.0 /100 | #213 | Tragic 9.7% |
| Immigrants | Micronesia | 6.7 /100 | #214 | Tragic 9.8% |
| Immigrants | Nonimmigrants | 6.7 /100 | #215 | Tragic 9.8% |
| Moroccans | 6.5 /100 | #216 | Tragic 9.8% |
| Americans | 6.2 /100 | #217 | Tragic 9.8% |
| Panamanians | 5.6 /100 | #218 | Tragic 9.8% |
| Immigrants | Eritrea | 5.4 /100 | #219 | Tragic 9.9% |
| Bermudans | 5.3 /100 | #220 | Tragic 9.9% |
| Immigrants | Cambodia | 4.8 /100 | #221 | Tragic 9.9% |