Shoshone vs Immigrants from Micronesia Family Poverty
COMPARE
Shoshone
Immigrants from Micronesia
Family Poverty
Family Poverty Comparison
Shoshone
Immigrants from Micronesia
10.9%
FAMILY POVERTY
0.2/ 100
METRIC RATING
261st/ 347
METRIC RANK
9.8%
FAMILY POVERTY
6.7/ 100
METRIC RATING
214th/ 347
METRIC RANK
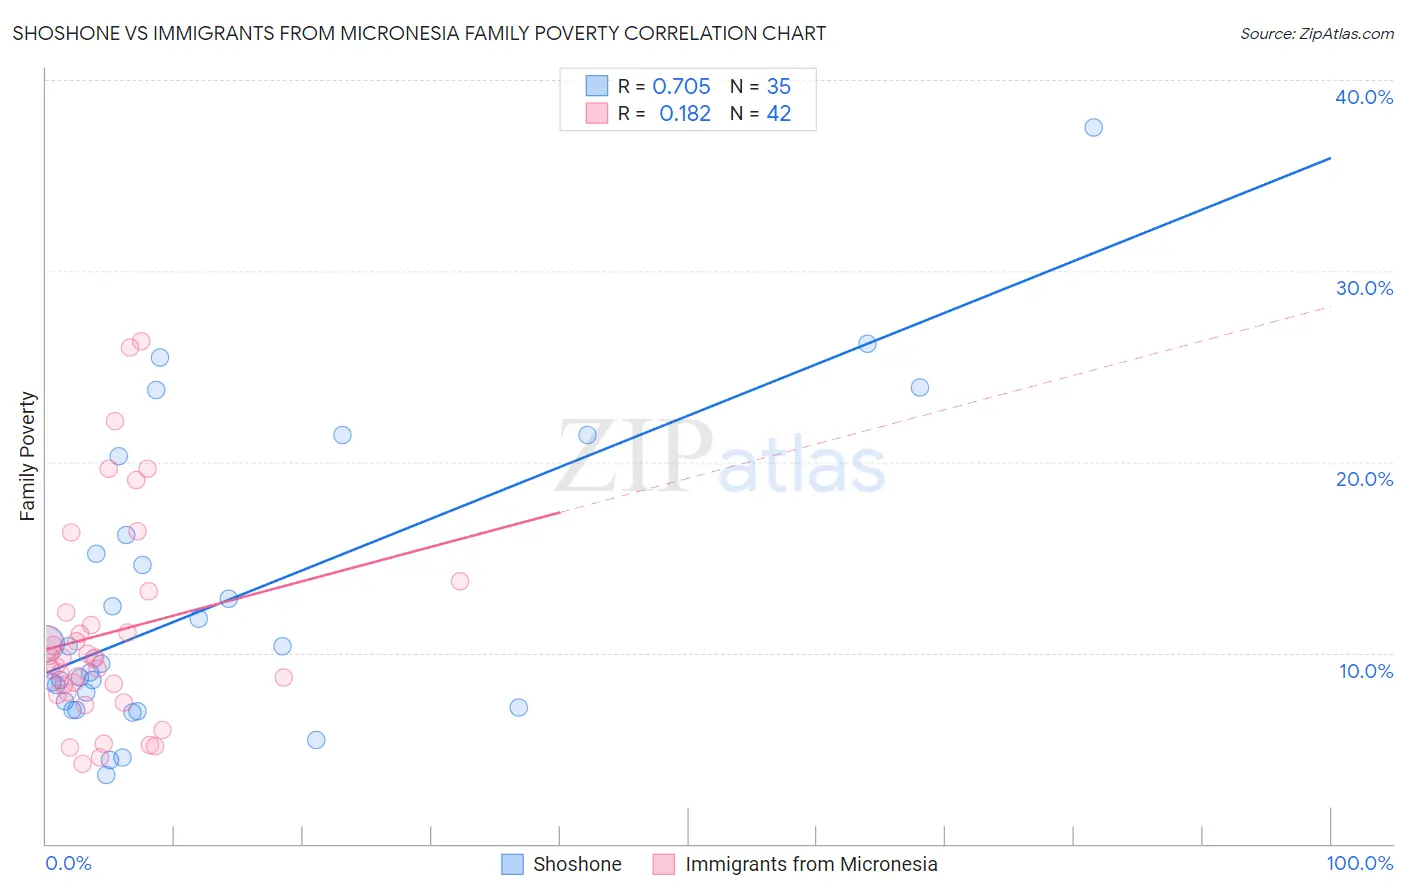
Shoshone vs Immigrants from Micronesia Family Poverty Correlation Chart
The statistical analysis conducted on geographies consisting of 66,600,445 people shows a strong positive correlation between the proportion of Shoshone and poverty level among families in the United States with a correlation coefficient (R) of 0.705 and weighted average of 10.9%. Similarly, the statistical analysis conducted on geographies consisting of 61,589,197 people shows a poor positive correlation between the proportion of Immigrants from Micronesia and poverty level among families in the United States with a correlation coefficient (R) of 0.182 and weighted average of 9.8%, a difference of 11.4%.
Family Poverty Correlation Summary
| Measurement | Shoshone | Immigrants from Micronesia |
| Minimum | 3.6% | 4.2% |
| Maximum | 37.5% | 26.3% |
| Range | 33.9% | 22.1% |
| Mean | 12.7% | 11.0% |
| Median | 9.4% | 9.7% |
| Interquartile 25% (IQ1) | 7.1% | 7.9% |
| Interquartile 75% (IQ3) | 16.2% | 12.1% |
| Interquartile Range (IQR) | 9.0% | 4.2% |
| Standard Deviation (Sample) | 7.8% | 5.5% |
| Standard Deviation (Population) | 7.7% | 5.4% |
Similar Demographics by Family Poverty
Demographics Similar to Shoshone by Family Poverty
In terms of family poverty, the demographic groups most similar to Shoshone are Bangladeshi (10.9%, a difference of 0.030%), Spanish American Indian (10.9%, a difference of 0.13%), Mexican American Indian (10.9%, a difference of 0.38%), Cape Verdean (10.9%, a difference of 0.39%), and Trinidadian and Tobagonian (10.9%, a difference of 0.41%).
| Demographics | Rating | Rank | Family Poverty |
| Ecuadorians | 0.2 /100 | #254 | Tragic 10.8% |
| Immigrants | Liberia | 0.2 /100 | #255 | Tragic 10.8% |
| Chickasaw | 0.2 /100 | #256 | Tragic 10.8% |
| Immigrants | Ghana | 0.2 /100 | #257 | Tragic 10.8% |
| Sub-Saharan Africans | 0.2 /100 | #258 | Tragic 10.9% |
| Mexican American Indians | 0.2 /100 | #259 | Tragic 10.9% |
| Bangladeshis | 0.2 /100 | #260 | Tragic 10.9% |
| Shoshone | 0.2 /100 | #261 | Tragic 10.9% |
| Spanish American Indians | 0.2 /100 | #262 | Tragic 10.9% |
| Cape Verdeans | 0.1 /100 | #263 | Tragic 10.9% |
| Trinidadians and Tobagonians | 0.1 /100 | #264 | Tragic 10.9% |
| Immigrants | Trinidad and Tobago | 0.1 /100 | #265 | Tragic 10.9% |
| Immigrants | El Salvador | 0.1 /100 | #266 | Tragic 11.0% |
| Comanche | 0.1 /100 | #267 | Tragic 11.0% |
| Jamaicans | 0.1 /100 | #268 | Tragic 11.1% |
Demographics Similar to Immigrants from Micronesia by Family Poverty
In terms of family poverty, the demographic groups most similar to Immigrants from Micronesia are Nonimmigrants (9.8%, a difference of 0.030%), Moroccan (9.8%, a difference of 0.090%), American (9.8%, a difference of 0.29%), Osage (9.7%, a difference of 0.58%), and Panamanian (9.8%, a difference of 0.61%).
| Demographics | Rating | Rank | Family Poverty |
| Sierra Leoneans | 15.6 /100 | #207 | Poor 9.5% |
| Immigrants | Eastern Africa | 15.1 /100 | #208 | Poor 9.5% |
| Immigrants | Uruguay | 14.0 /100 | #209 | Poor 9.5% |
| Alsatians | 11.3 /100 | #210 | Poor 9.6% |
| Malaysians | 10.6 /100 | #211 | Poor 9.6% |
| Immigrants | Thailand | 9.7 /100 | #212 | Tragic 9.7% |
| Osage | 8.0 /100 | #213 | Tragic 9.7% |
| Immigrants | Micronesia | 6.7 /100 | #214 | Tragic 9.8% |
| Immigrants | Nonimmigrants | 6.7 /100 | #215 | Tragic 9.8% |
| Moroccans | 6.5 /100 | #216 | Tragic 9.8% |
| Americans | 6.2 /100 | #217 | Tragic 9.8% |
| Panamanians | 5.6 /100 | #218 | Tragic 9.8% |
| Immigrants | Eritrea | 5.4 /100 | #219 | Tragic 9.9% |
| Bermudans | 5.3 /100 | #220 | Tragic 9.9% |
| Immigrants | Cambodia | 4.8 /100 | #221 | Tragic 9.9% |