Bahamian vs Immigrants from Micronesia Family Poverty
COMPARE
Bahamian
Immigrants from Micronesia
Family Poverty
Family Poverty Comparison
Bahamians
Immigrants from Micronesia
11.7%
FAMILY POVERTY
0.0/ 100
METRIC RATING
301st/ 347
METRIC RANK
9.8%
FAMILY POVERTY
6.7/ 100
METRIC RATING
214th/ 347
METRIC RANK
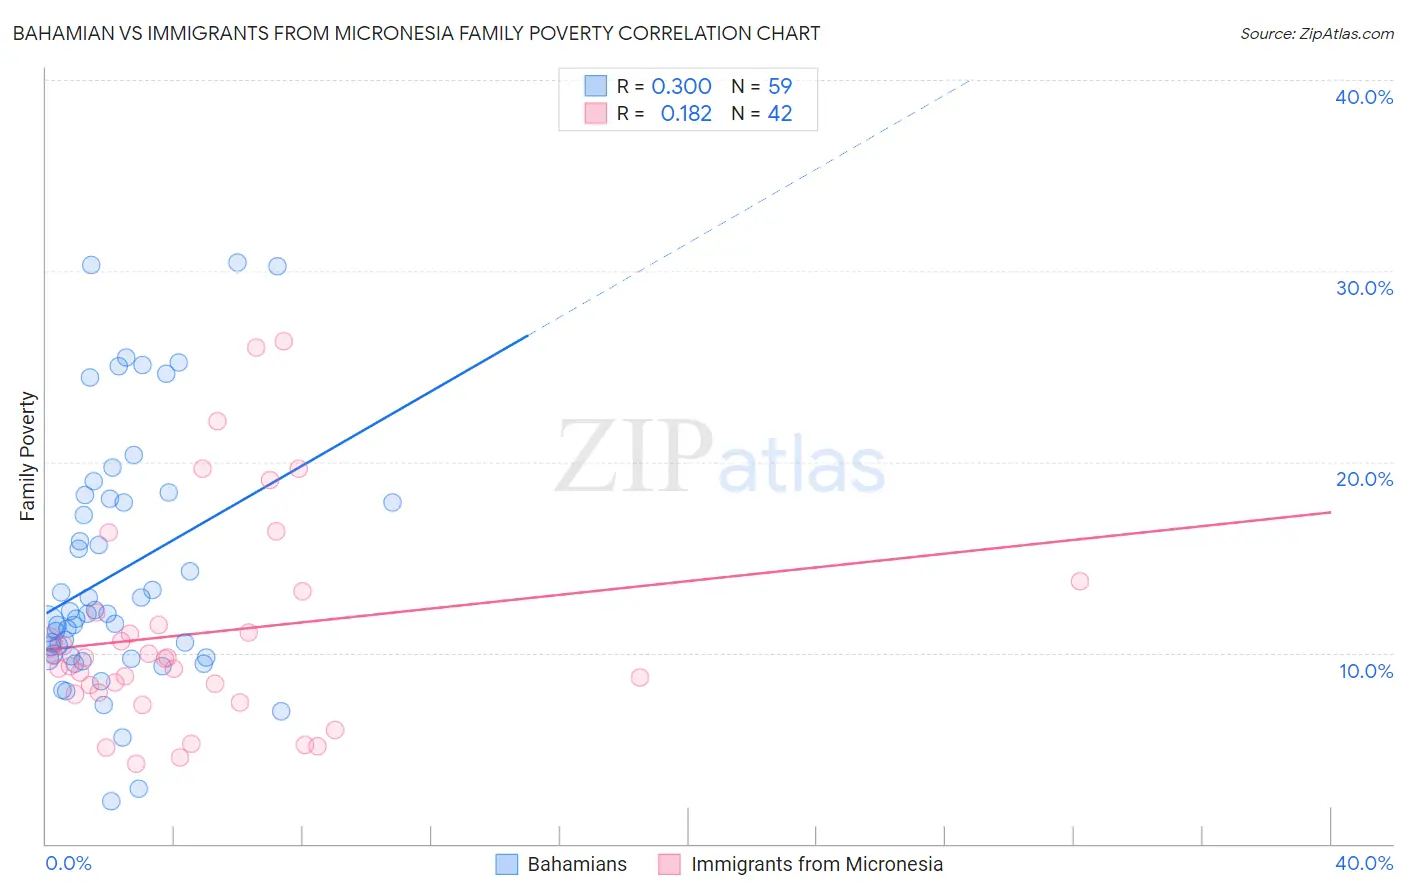
Bahamian vs Immigrants from Micronesia Family Poverty Correlation Chart
The statistical analysis conducted on geographies consisting of 112,580,407 people shows a weak positive correlation between the proportion of Bahamians and poverty level among families in the United States with a correlation coefficient (R) of 0.300 and weighted average of 11.7%. Similarly, the statistical analysis conducted on geographies consisting of 61,589,197 people shows a poor positive correlation between the proportion of Immigrants from Micronesia and poverty level among families in the United States with a correlation coefficient (R) of 0.182 and weighted average of 9.8%, a difference of 19.7%.
Family Poverty Correlation Summary
| Measurement | Bahamian | Immigrants from Micronesia |
| Minimum | 2.2% | 4.2% |
| Maximum | 30.4% | 26.3% |
| Range | 28.2% | 22.1% |
| Mean | 14.2% | 11.0% |
| Median | 12.1% | 9.7% |
| Interquartile 25% (IQ1) | 9.7% | 7.9% |
| Interquartile 75% (IQ3) | 18.1% | 12.1% |
| Interquartile Range (IQR) | 8.3% | 4.2% |
| Standard Deviation (Sample) | 6.6% | 5.5% |
| Standard Deviation (Population) | 6.6% | 5.4% |
Similar Demographics by Family Poverty
Demographics Similar to Bahamians by Family Poverty
In terms of family poverty, the demographic groups most similar to Bahamians are Guatemalan (11.7%, a difference of 0.040%), Immigrants from Bangladesh (11.7%, a difference of 0.25%), Dutch West Indian (11.7%, a difference of 0.27%), Immigrants from Senegal (11.7%, a difference of 0.36%), and Creek (11.7%, a difference of 0.50%).
| Demographics | Rating | Rank | Family Poverty |
| Immigrants | St. Vincent and the Grenadines | 0.0 /100 | #294 | Tragic 11.6% |
| Immigrants | Haiti | 0.0 /100 | #295 | Tragic 11.6% |
| Choctaw | 0.0 /100 | #296 | Tragic 11.6% |
| Creek | 0.0 /100 | #297 | Tragic 11.7% |
| Immigrants | Senegal | 0.0 /100 | #298 | Tragic 11.7% |
| Dutch West Indians | 0.0 /100 | #299 | Tragic 11.7% |
| Immigrants | Bangladesh | 0.0 /100 | #300 | Tragic 11.7% |
| Bahamians | 0.0 /100 | #301 | Tragic 11.7% |
| Guatemalans | 0.0 /100 | #302 | Tragic 11.7% |
| Africans | 0.0 /100 | #303 | Tragic 11.8% |
| Immigrants | Latin America | 0.0 /100 | #304 | Tragic 11.8% |
| Mexicans | 0.0 /100 | #305 | Tragic 11.8% |
| Cajuns | 0.0 /100 | #306 | Tragic 11.9% |
| Immigrants | Congo | 0.0 /100 | #307 | Tragic 11.9% |
| Seminole | 0.0 /100 | #308 | Tragic 11.9% |
Demographics Similar to Immigrants from Micronesia by Family Poverty
In terms of family poverty, the demographic groups most similar to Immigrants from Micronesia are Nonimmigrants (9.8%, a difference of 0.030%), Moroccan (9.8%, a difference of 0.090%), American (9.8%, a difference of 0.29%), Osage (9.7%, a difference of 0.58%), and Panamanian (9.8%, a difference of 0.61%).
| Demographics | Rating | Rank | Family Poverty |
| Sierra Leoneans | 15.6 /100 | #207 | Poor 9.5% |
| Immigrants | Eastern Africa | 15.1 /100 | #208 | Poor 9.5% |
| Immigrants | Uruguay | 14.0 /100 | #209 | Poor 9.5% |
| Alsatians | 11.3 /100 | #210 | Poor 9.6% |
| Malaysians | 10.6 /100 | #211 | Poor 9.6% |
| Immigrants | Thailand | 9.7 /100 | #212 | Tragic 9.7% |
| Osage | 8.0 /100 | #213 | Tragic 9.7% |
| Immigrants | Micronesia | 6.7 /100 | #214 | Tragic 9.8% |
| Immigrants | Nonimmigrants | 6.7 /100 | #215 | Tragic 9.8% |
| Moroccans | 6.5 /100 | #216 | Tragic 9.8% |
| Americans | 6.2 /100 | #217 | Tragic 9.8% |
| Panamanians | 5.6 /100 | #218 | Tragic 9.8% |
| Immigrants | Eritrea | 5.4 /100 | #219 | Tragic 9.9% |
| Bermudans | 5.3 /100 | #220 | Tragic 9.9% |
| Immigrants | Cambodia | 4.8 /100 | #221 | Tragic 9.9% |