Tlingit-Haida vs Immigrants from Micronesia Unemployment Among Ages 30 to 34 years
COMPARE
Tlingit-Haida
Immigrants from Micronesia
Unemployment Among Ages 30 to 34 years
Unemployment Among Ages 30 to 34 years Comparison
Tlingit-Haida
Immigrants from Micronesia
6.0%
UNEMPLOYMENT AMONG AGES 30 TO 34 YEARS
0.2/ 100
METRIC RATING
251st/ 347
METRIC RANK
6.0%
UNEMPLOYMENT AMONG AGES 30 TO 34 YEARS
0.3/ 100
METRIC RATING
244th/ 347
METRIC RANK
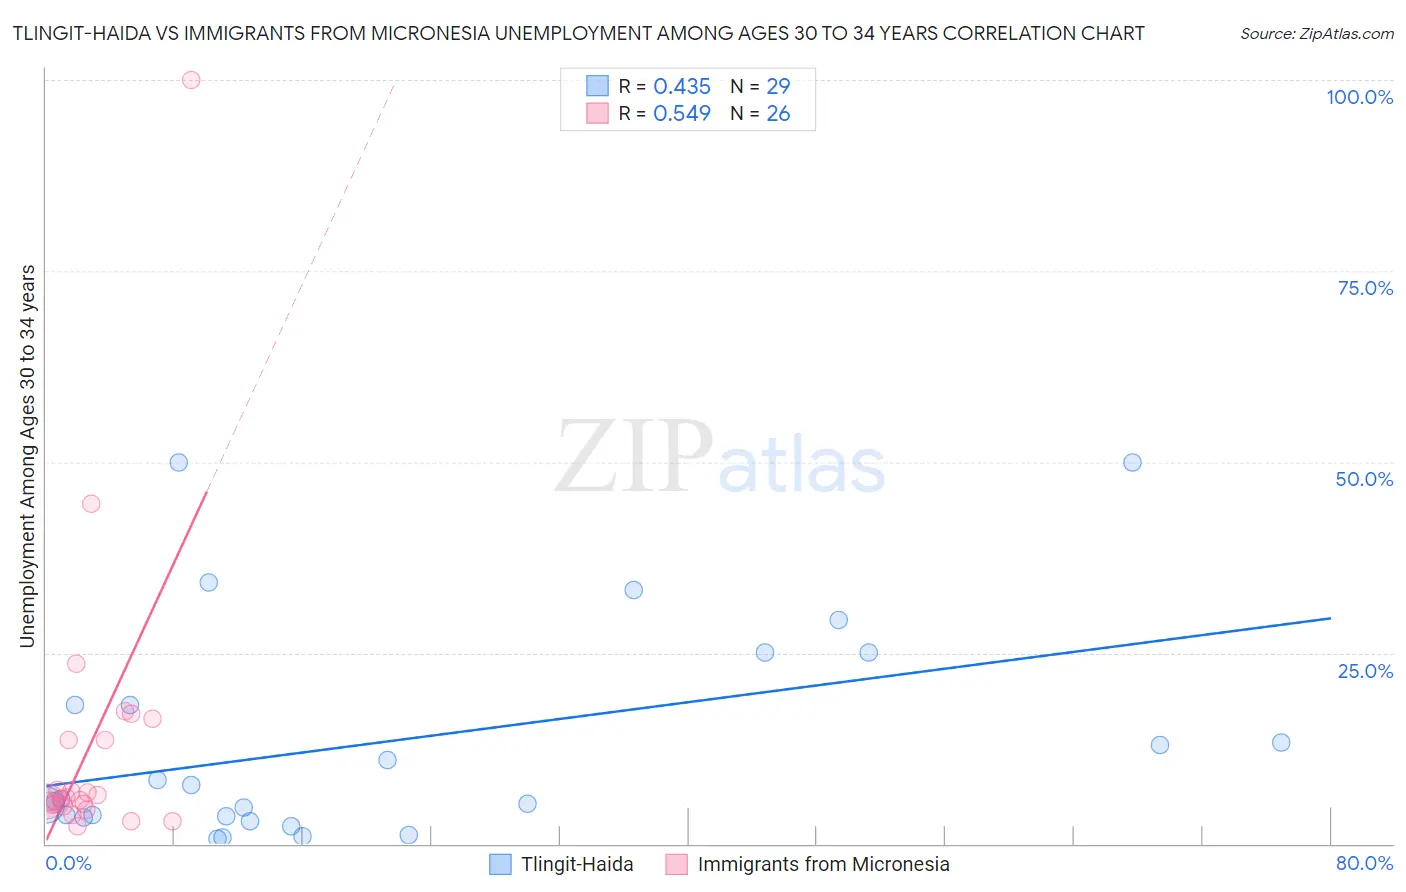
Tlingit-Haida vs Immigrants from Micronesia Unemployment Among Ages 30 to 34 years Correlation Chart
The statistical analysis conducted on geographies consisting of 59,624,165 people shows a moderate positive correlation between the proportion of Tlingit-Haida and unemployment rate among population between the ages 30 and 34 in the United States with a correlation coefficient (R) of 0.435 and weighted average of 6.0%. Similarly, the statistical analysis conducted on geographies consisting of 60,757,387 people shows a substantial positive correlation between the proportion of Immigrants from Micronesia and unemployment rate among population between the ages 30 and 34 in the United States with a correlation coefficient (R) of 0.549 and weighted average of 6.0%, a difference of 0.56%.
Unemployment Among Ages 30 to 34 years Correlation Summary
| Measurement | Tlingit-Haida | Immigrants from Micronesia |
| Minimum | 0.60% | 2.3% |
| Maximum | 50.0% | 100.0% |
| Range | 49.4% | 97.7% |
| Mean | 13.3% | 13.0% |
| Median | 5.9% | 5.9% |
| Interquartile 25% (IQ1) | 3.5% | 5.1% |
| Interquartile 75% (IQ3) | 21.6% | 13.6% |
| Interquartile Range (IQR) | 18.1% | 8.5% |
| Standard Deviation (Sample) | 14.3% | 19.9% |
| Standard Deviation (Population) | 14.0% | 19.5% |
Demographics Similar to Tlingit-Haida and Immigrants from Micronesia by Unemployment Among Ages 30 to 34 years
In terms of unemployment among ages 30 to 34 years, the demographic groups most similar to Tlingit-Haida are Potawatomi (6.0%, a difference of 0.020%), Immigrants from Honduras (6.0%, a difference of 0.20%), Immigrants from Guatemala (6.0%, a difference of 0.29%), Honduran (6.0%, a difference of 0.29%), and Nigerian (6.0%, a difference of 0.30%). Similarly, the demographic groups most similar to Immigrants from Micronesia are Subsaharan African (6.0%, a difference of 0.020%), Immigrants from Liberia (6.0%, a difference of 0.15%), Ghanaian (6.0%, a difference of 0.20%), Guatemalan (6.0%, a difference of 0.21%), and Nigerian (6.0%, a difference of 0.27%).
| Demographics | Rating | Rank | Unemployment Among Ages 30 to 34 years |
| Central Americans | 0.6 /100 | #237 | Tragic 5.9% |
| Mexican American Indians | 0.6 /100 | #238 | Tragic 5.9% |
| Immigrants | Nigeria | 0.6 /100 | #239 | Tragic 6.0% |
| Salvadorans | 0.5 /100 | #240 | Tragic 6.0% |
| Immigrants | El Salvador | 0.5 /100 | #241 | Tragic 6.0% |
| Guatemalans | 0.4 /100 | #242 | Tragic 6.0% |
| Immigrants | Liberia | 0.4 /100 | #243 | Tragic 6.0% |
| Immigrants | Micronesia | 0.3 /100 | #244 | Tragic 6.0% |
| Sub-Saharan Africans | 0.3 /100 | #245 | Tragic 6.0% |
| Ghanaians | 0.3 /100 | #246 | Tragic 6.0% |
| Nigerians | 0.3 /100 | #247 | Tragic 6.0% |
| Immigrants | Guatemala | 0.3 /100 | #248 | Tragic 6.0% |
| Hondurans | 0.3 /100 | #249 | Tragic 6.0% |
| Immigrants | Honduras | 0.3 /100 | #250 | Tragic 6.0% |
| Tlingit-Haida | 0.2 /100 | #251 | Tragic 6.0% |
| Potawatomi | 0.2 /100 | #252 | Tragic 6.0% |
| Immigrants | Nonimmigrants | 0.2 /100 | #253 | Tragic 6.1% |
| Armenians | 0.1 /100 | #254 | Tragic 6.1% |
| Immigrants | Portugal | 0.1 /100 | #255 | Tragic 6.1% |
| Immigrants | Ghana | 0.1 /100 | #256 | Tragic 6.1% |
| Immigrants | Sierra Leone | 0.1 /100 | #257 | Tragic 6.1% |