Immigrants from Switzerland vs Immigrants from Micronesia Family Poverty
COMPARE
Immigrants from Switzerland
Immigrants from Micronesia
Family Poverty
Family Poverty Comparison
Immigrants from Switzerland
Immigrants from Micronesia
8.1%
FAMILY POVERTY
96.1/ 100
METRIC RATING
97th/ 347
METRIC RANK
9.8%
FAMILY POVERTY
6.7/ 100
METRIC RATING
214th/ 347
METRIC RANK
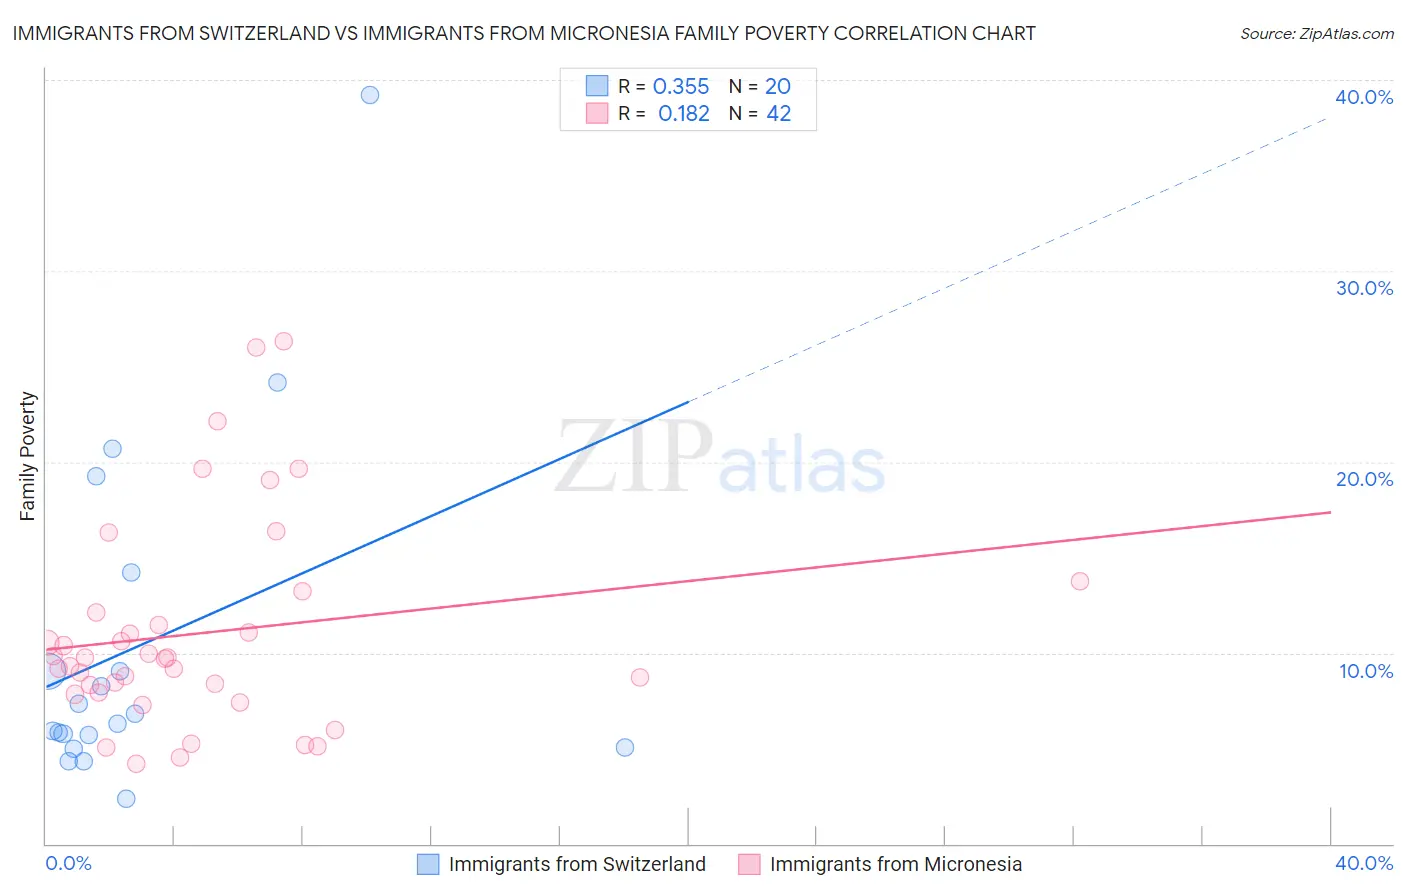
Immigrants from Switzerland vs Immigrants from Micronesia Family Poverty Correlation Chart
The statistical analysis conducted on geographies consisting of 147,922,472 people shows a mild positive correlation between the proportion of Immigrants from Switzerland and poverty level among families in the United States with a correlation coefficient (R) of 0.355 and weighted average of 8.1%. Similarly, the statistical analysis conducted on geographies consisting of 61,589,197 people shows a poor positive correlation between the proportion of Immigrants from Micronesia and poverty level among families in the United States with a correlation coefficient (R) of 0.182 and weighted average of 9.8%, a difference of 21.4%.
Family Poverty Correlation Summary
| Measurement | Immigrants from Switzerland | Immigrants from Micronesia |
| Minimum | 2.3% | 4.2% |
| Maximum | 39.2% | 26.3% |
| Range | 36.8% | 22.1% |
| Mean | 10.4% | 11.0% |
| Median | 6.5% | 9.7% |
| Interquartile 25% (IQ1) | 5.4% | 7.9% |
| Interquartile 75% (IQ3) | 11.6% | 12.1% |
| Interquartile Range (IQR) | 6.3% | 4.2% |
| Standard Deviation (Sample) | 9.0% | 5.5% |
| Standard Deviation (Population) | 8.8% | 5.4% |
Similar Demographics by Family Poverty
Demographics Similar to Immigrants from Switzerland by Family Poverty
In terms of family poverty, the demographic groups most similar to Immigrants from Switzerland are Immigrants from South Africa (8.1%, a difference of 0.21%), Welsh (8.1%, a difference of 0.28%), New Zealander (8.1%, a difference of 0.35%), Immigrants from Norway (8.1%, a difference of 0.38%), and Immigrants from Indonesia (8.1%, a difference of 0.39%).
| Demographics | Rating | Rank | Family Poverty |
| Immigrants | England | 97.1 /100 | #90 | Exceptional 8.0% |
| Immigrants | Italy | 97.0 /100 | #91 | Exceptional 8.0% |
| Czechoslovakians | 96.8 /100 | #92 | Exceptional 8.0% |
| Tlingit-Haida | 96.7 /100 | #93 | Exceptional 8.0% |
| Immigrants | Pakistan | 96.6 /100 | #94 | Exceptional 8.0% |
| Immigrants | Philippines | 96.5 /100 | #95 | Exceptional 8.0% |
| Immigrants | Turkey | 96.5 /100 | #96 | Exceptional 8.0% |
| Immigrants | Switzerland | 96.1 /100 | #97 | Exceptional 8.1% |
| Immigrants | South Africa | 95.9 /100 | #98 | Exceptional 8.1% |
| Welsh | 95.8 /100 | #99 | Exceptional 8.1% |
| New Zealanders | 95.8 /100 | #100 | Exceptional 8.1% |
| Immigrants | Norway | 95.7 /100 | #101 | Exceptional 8.1% |
| Immigrants | Indonesia | 95.7 /100 | #102 | Exceptional 8.1% |
| Immigrants | Eastern Europe | 95.6 /100 | #103 | Exceptional 8.1% |
| Slavs | 95.6 /100 | #104 | Exceptional 8.1% |
Demographics Similar to Immigrants from Micronesia by Family Poverty
In terms of family poverty, the demographic groups most similar to Immigrants from Micronesia are Nonimmigrants (9.8%, a difference of 0.030%), Moroccan (9.8%, a difference of 0.090%), American (9.8%, a difference of 0.29%), Osage (9.7%, a difference of 0.58%), and Panamanian (9.8%, a difference of 0.61%).
| Demographics | Rating | Rank | Family Poverty |
| Sierra Leoneans | 15.6 /100 | #207 | Poor 9.5% |
| Immigrants | Eastern Africa | 15.1 /100 | #208 | Poor 9.5% |
| Immigrants | Uruguay | 14.0 /100 | #209 | Poor 9.5% |
| Alsatians | 11.3 /100 | #210 | Poor 9.6% |
| Malaysians | 10.6 /100 | #211 | Poor 9.6% |
| Immigrants | Thailand | 9.7 /100 | #212 | Tragic 9.7% |
| Osage | 8.0 /100 | #213 | Tragic 9.7% |
| Immigrants | Micronesia | 6.7 /100 | #214 | Tragic 9.8% |
| Immigrants | Nonimmigrants | 6.7 /100 | #215 | Tragic 9.8% |
| Moroccans | 6.5 /100 | #216 | Tragic 9.8% |
| Americans | 6.2 /100 | #217 | Tragic 9.8% |
| Panamanians | 5.6 /100 | #218 | Tragic 9.8% |
| Immigrants | Eritrea | 5.4 /100 | #219 | Tragic 9.9% |
| Bermudans | 5.3 /100 | #220 | Tragic 9.9% |
| Immigrants | Cambodia | 4.8 /100 | #221 | Tragic 9.9% |