Tlingit-Haida vs Ecuadorian Disability Age 35 to 64
COMPARE
Tlingit-Haida
Ecuadorian
Disability Age 35 to 64
Disability Age 35 to 64 Comparison
Tlingit-Haida
Ecuadorians
13.2%
DISABILITY AGE 35 TO 64
0.0/ 100
METRIC RATING
287th/ 347
METRIC RANK
10.7%
DISABILITY AGE 35 TO 64
93.1/ 100
METRIC RATING
129th/ 347
METRIC RANK
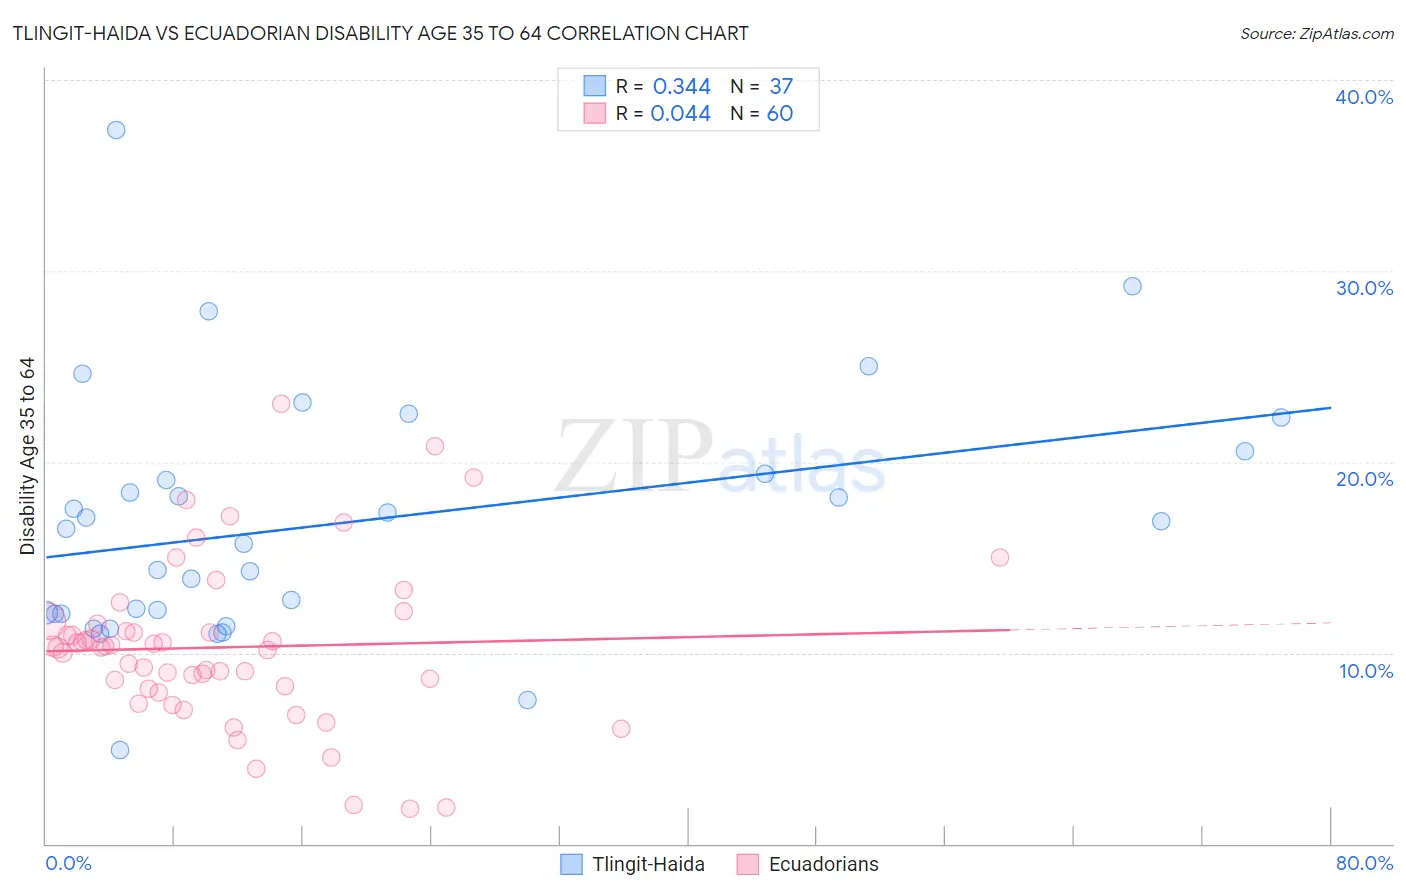
Tlingit-Haida vs Ecuadorian Disability Age 35 to 64 Correlation Chart
The statistical analysis conducted on geographies consisting of 60,853,720 people shows a mild positive correlation between the proportion of Tlingit-Haida and percentage of population with a disability between the ages 34 and 64 in the United States with a correlation coefficient (R) of 0.344 and weighted average of 13.2%. Similarly, the statistical analysis conducted on geographies consisting of 317,605,985 people shows no correlation between the proportion of Ecuadorians and percentage of population with a disability between the ages 34 and 64 in the United States with a correlation coefficient (R) of 0.044 and weighted average of 10.7%, a difference of 23.4%.
Disability Age 35 to 64 Correlation Summary
| Measurement | Tlingit-Haida | Ecuadorian |
| Minimum | 4.9% | 1.8% |
| Maximum | 37.4% | 23.1% |
| Range | 32.4% | 21.2% |
| Mean | 16.8% | 10.3% |
| Median | 16.5% | 10.3% |
| Interquartile 25% (IQ1) | 12.1% | 8.2% |
| Interquartile 75% (IQ3) | 20.0% | 11.3% |
| Interquartile Range (IQR) | 7.9% | 3.2% |
| Standard Deviation (Sample) | 6.5% | 4.2% |
| Standard Deviation (Population) | 6.4% | 4.2% |
Similar Demographics by Disability Age 35 to 64
Demographics Similar to Tlingit-Haida by Disability Age 35 to 64
In terms of disability age 35 to 64, the demographic groups most similar to Tlingit-Haida are Hmong (13.1%, a difference of 0.27%), Fijian (13.2%, a difference of 0.35%), Indonesian (13.2%, a difference of 0.42%), Immigrants from Liberia (13.2%, a difference of 0.50%), and Immigrants from Somalia (13.1%, a difference of 0.58%).
| Demographics | Rating | Rank | Disability Age 35 to 64 |
| Liberians | 0.1 /100 | #280 | Tragic 12.9% |
| Scotch-Irish | 0.1 /100 | #281 | Tragic 13.0% |
| Immigrants | Laos | 0.1 /100 | #282 | Tragic 13.0% |
| Central American Indians | 0.0 /100 | #283 | Tragic 13.0% |
| Immigrants | Nonimmigrants | 0.0 /100 | #284 | Tragic 13.0% |
| Immigrants | Somalia | 0.0 /100 | #285 | Tragic 13.1% |
| Hmong | 0.0 /100 | #286 | Tragic 13.1% |
| Tlingit-Haida | 0.0 /100 | #287 | Tragic 13.2% |
| Fijians | 0.0 /100 | #288 | Tragic 13.2% |
| Indonesians | 0.0 /100 | #289 | Tragic 13.2% |
| Immigrants | Liberia | 0.0 /100 | #290 | Tragic 13.2% |
| Immigrants | Congo | 0.0 /100 | #291 | Tragic 13.3% |
| Puget Sound Salish | 0.0 /100 | #292 | Tragic 13.3% |
| Ute | 0.0 /100 | #293 | Tragic 13.4% |
| Yaqui | 0.0 /100 | #294 | Tragic 13.5% |
Demographics Similar to Ecuadorians by Disability Age 35 to 64
In terms of disability age 35 to 64, the demographic groups most similar to Ecuadorians are Immigrants from Syria (10.7%, a difference of 0.020%), South African (10.7%, a difference of 0.080%), Immigrants from El Salvador (10.7%, a difference of 0.080%), Immigrants from Albania (10.7%, a difference of 0.18%), and Immigrants (10.7%, a difference of 0.19%).
| Demographics | Rating | Rank | Disability Age 35 to 64 |
| Immigrants | Norway | 95.0 /100 | #122 | Exceptional 10.6% |
| Maltese | 94.8 /100 | #123 | Exceptional 10.6% |
| Estonians | 94.5 /100 | #124 | Exceptional 10.6% |
| Albanians | 94.2 /100 | #125 | Exceptional 10.6% |
| Immigrants | Afghanistan | 94.1 /100 | #126 | Exceptional 10.6% |
| Immigrants | Zimbabwe | 94.0 /100 | #127 | Exceptional 10.6% |
| South Africans | 93.3 /100 | #128 | Exceptional 10.7% |
| Ecuadorians | 93.1 /100 | #129 | Exceptional 10.7% |
| Immigrants | Syria | 93.0 /100 | #130 | Exceptional 10.7% |
| Immigrants | El Salvador | 92.8 /100 | #131 | Exceptional 10.7% |
| Immigrants | Albania | 92.5 /100 | #132 | Exceptional 10.7% |
| Immigrants | Immigrants | 92.5 /100 | #133 | Exceptional 10.7% |
| Immigrants | Ecuador | 92.5 /100 | #134 | Exceptional 10.7% |
| Greeks | 92.3 /100 | #135 | Exceptional 10.7% |
| Salvadorans | 91.9 /100 | #136 | Exceptional 10.7% |