Sudanese vs Ecuadorian Single Father Poverty
COMPARE
Sudanese
Ecuadorian
Single Father Poverty
Single Father Poverty Comparison
Sudanese
Ecuadorians
15.9%
SINGLE FATHER POVERTY
91.6/ 100
METRIC RATING
122nd/ 347
METRIC RANK
16.5%
SINGLE FATHER POVERTY
24.5/ 100
METRIC RATING
193rd/ 347
METRIC RANK
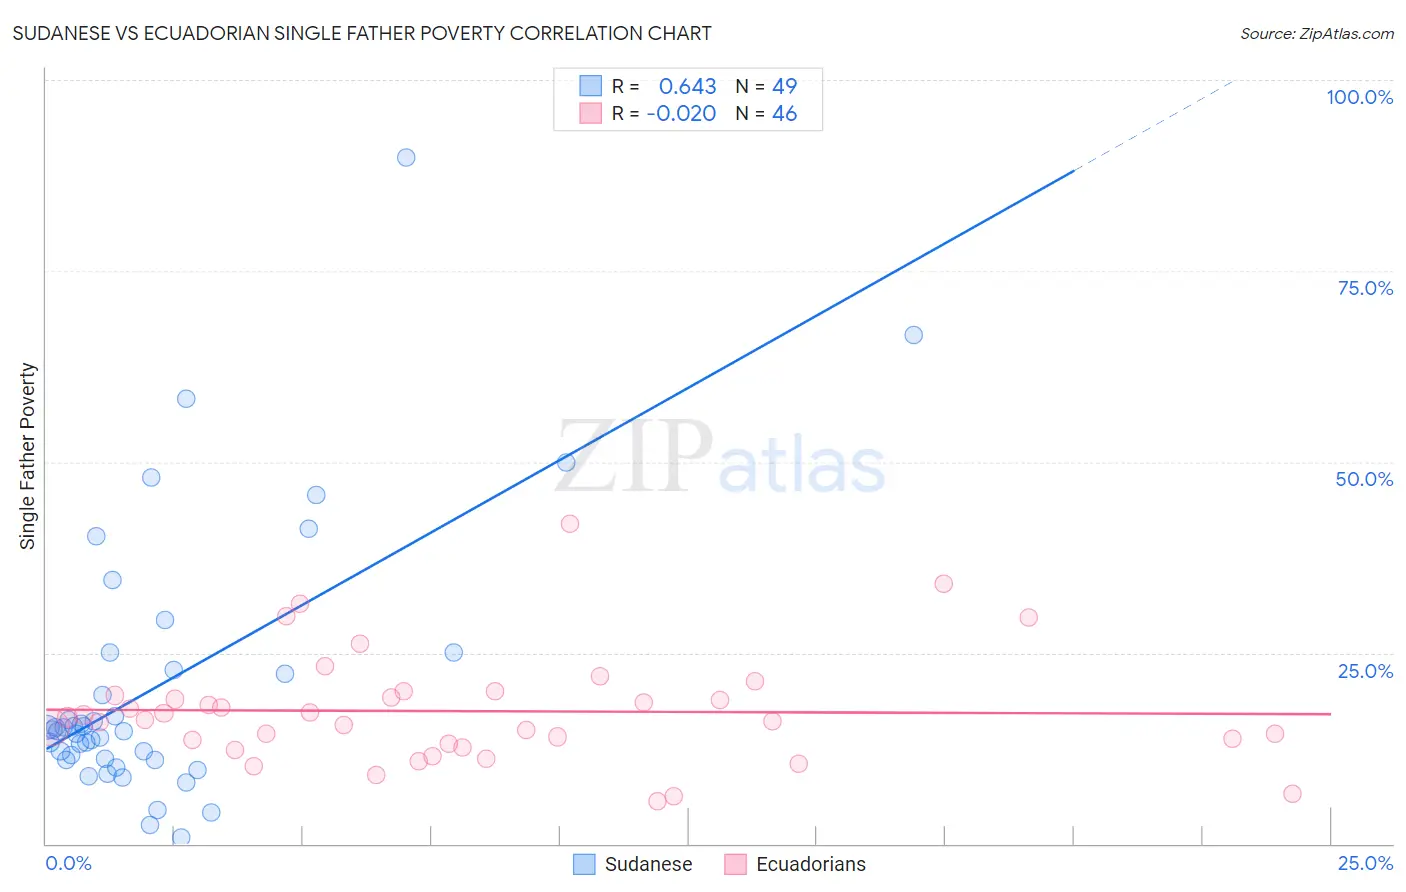
Sudanese vs Ecuadorian Single Father Poverty Correlation Chart
The statistical analysis conducted on geographies consisting of 100,935,814 people shows a significant positive correlation between the proportion of Sudanese and poverty level among single fathers in the United States with a correlation coefficient (R) of 0.643 and weighted average of 15.9%. Similarly, the statistical analysis conducted on geographies consisting of 258,169,372 people shows no correlation between the proportion of Ecuadorians and poverty level among single fathers in the United States with a correlation coefficient (R) of -0.020 and weighted average of 16.5%, a difference of 4.0%.
Single Father Poverty Correlation Summary
| Measurement | Sudanese | Ecuadorian |
| Minimum | 0.76% | 5.6% |
| Maximum | 89.9% | 41.9% |
| Range | 89.1% | 36.3% |
| Mean | 20.8% | 17.4% |
| Median | 14.9% | 16.4% |
| Interquartile 25% (IQ1) | 11.0% | 13.2% |
| Interquartile 75% (IQ3) | 23.9% | 19.4% |
| Interquartile Range (IQR) | 12.9% | 6.2% |
| Standard Deviation (Sample) | 17.6% | 7.2% |
| Standard Deviation (Population) | 17.4% | 7.2% |
Similar Demographics by Single Father Poverty
Demographics Similar to Sudanese by Single Father Poverty
In terms of single father poverty, the demographic groups most similar to Sudanese are Palestinian (15.9%, a difference of 0.040%), Immigrants from Panama (15.9%, a difference of 0.040%), Iraqi (15.9%, a difference of 0.050%), Immigrants (15.9%, a difference of 0.060%), and Hmong (15.9%, a difference of 0.070%).
| Demographics | Rating | Rank | Single Father Poverty |
| Immigrants | Thailand | 93.6 /100 | #115 | Exceptional 15.8% |
| Immigrants | Argentina | 92.8 /100 | #116 | Exceptional 15.8% |
| Immigrants | Colombia | 92.6 /100 | #117 | Exceptional 15.8% |
| Immigrants | Eastern Europe | 92.5 /100 | #118 | Exceptional 15.8% |
| Immigrants | Belarus | 92.4 /100 | #119 | Exceptional 15.8% |
| Uruguayans | 92.1 /100 | #120 | Exceptional 15.9% |
| Immigrants | Immigrants | 91.9 /100 | #121 | Exceptional 15.9% |
| Sudanese | 91.6 /100 | #122 | Exceptional 15.9% |
| Palestinians | 91.3 /100 | #123 | Exceptional 15.9% |
| Immigrants | Panama | 91.3 /100 | #124 | Exceptional 15.9% |
| Iraqis | 91.2 /100 | #125 | Exceptional 15.9% |
| Hmong | 91.1 /100 | #126 | Exceptional 15.9% |
| Immigrants | Liberia | 91.1 /100 | #127 | Exceptional 15.9% |
| Immigrants | Nigeria | 90.8 /100 | #128 | Exceptional 15.9% |
| Immigrants | West Indies | 90.8 /100 | #129 | Exceptional 15.9% |
Demographics Similar to Ecuadorians by Single Father Poverty
In terms of single father poverty, the demographic groups most similar to Ecuadorians are Immigrants from Switzerland (16.5%, a difference of 0.010%), Cape Verdean (16.5%, a difference of 0.010%), Immigrants from Barbados (16.5%, a difference of 0.010%), Immigrants from Guyana (16.5%, a difference of 0.15%), and Immigrants from Canada (16.5%, a difference of 0.16%).
| Demographics | Rating | Rank | Single Father Poverty |
| Immigrants | Venezuela | 31.0 /100 | #186 | Fair 16.4% |
| Ukrainians | 30.4 /100 | #187 | Fair 16.4% |
| Russians | 30.1 /100 | #188 | Fair 16.4% |
| Latvians | 28.9 /100 | #189 | Fair 16.5% |
| Immigrants | Burma/Myanmar | 28.0 /100 | #190 | Fair 16.5% |
| Immigrants | Guyana | 27.1 /100 | #191 | Fair 16.5% |
| Immigrants | Switzerland | 24.8 /100 | #192 | Fair 16.5% |
| Ecuadorians | 24.5 /100 | #193 | Fair 16.5% |
| Cape Verdeans | 24.4 /100 | #194 | Fair 16.5% |
| Immigrants | Barbados | 24.3 /100 | #195 | Fair 16.5% |
| Immigrants | Canada | 21.9 /100 | #196 | Fair 16.5% |
| Immigrants | Northern Europe | 20.3 /100 | #197 | Fair 16.5% |
| Romanians | 20.1 /100 | #198 | Fair 16.5% |
| Immigrants | Belize | 19.8 /100 | #199 | Poor 16.5% |
| Syrians | 17.4 /100 | #200 | Poor 16.6% |