Tlingit-Haida vs Ecuadorian Unemployment Among Seniors over 65 years
COMPARE
Tlingit-Haida
Ecuadorian
Unemployment Among Seniors over 65 years
Unemployment Among Seniors over 65 years Comparison
Tlingit-Haida
Ecuadorians
6.8%
UNEMPLOYMENT AMONG SENIORS OVER 65 YEARS
0.0/ 100
METRIC RATING
343rd/ 347
METRIC RANK
5.6%
UNEMPLOYMENT AMONG SENIORS OVER 65 YEARS
0.0/ 100
METRIC RATING
306th/ 347
METRIC RANK
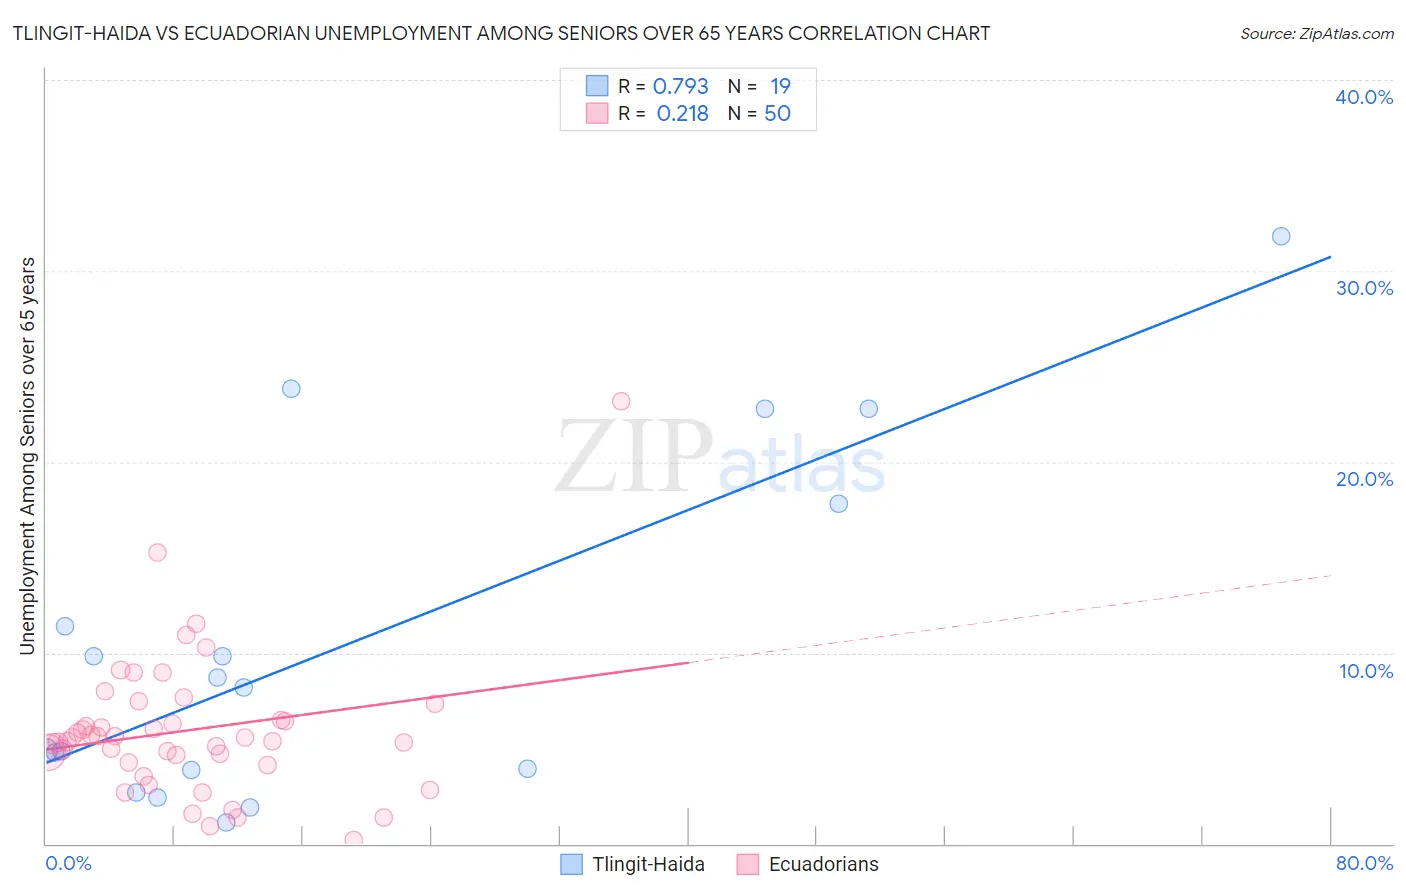
Tlingit-Haida vs Ecuadorian Unemployment Among Seniors over 65 years Correlation Chart
The statistical analysis conducted on geographies consisting of 57,782,692 people shows a strong positive correlation between the proportion of Tlingit-Haida and unemployment rate amomg seniors over the age of 65 in the United States with a correlation coefficient (R) of 0.793 and weighted average of 6.8%. Similarly, the statistical analysis conducted on geographies consisting of 294,826,024 people shows a weak positive correlation between the proportion of Ecuadorians and unemployment rate amomg seniors over the age of 65 in the United States with a correlation coefficient (R) of 0.218 and weighted average of 5.6%, a difference of 21.2%.
Unemployment Among Seniors over 65 years Correlation Summary
| Measurement | Tlingit-Haida | Ecuadorian |
| Minimum | 1.1% | 0.20% |
| Maximum | 31.8% | 23.2% |
| Range | 30.7% | 23.0% |
| Mean | 10.4% | 5.9% |
| Median | 8.2% | 5.5% |
| Interquartile 25% (IQ1) | 3.8% | 4.2% |
| Interquartile 75% (IQ3) | 17.8% | 6.5% |
| Interquartile Range (IQR) | 14.0% | 2.3% |
| Standard Deviation (Sample) | 9.0% | 3.8% |
| Standard Deviation (Population) | 8.8% | 3.7% |
Similar Demographics by Unemployment Among Seniors over 65 years
Demographics Similar to Tlingit-Haida by Unemployment Among Seniors over 65 years
In terms of unemployment among seniors over 65 years, the demographic groups most similar to Tlingit-Haida are Navajo (6.7%, a difference of 1.3%), Yakama (6.7%, a difference of 1.8%), Alaskan Athabascan (7.0%, a difference of 3.8%), Ute (6.3%, a difference of 7.2%), and Paiute (6.3%, a difference of 7.3%).
| Demographics | Rating | Rank | Unemployment Among Seniors over 65 years |
| Immigrants | Dominican Republic | 0.0 /100 | #333 | Tragic 6.0% |
| Tohono O'odham | 0.0 /100 | #334 | Tragic 6.1% |
| Immigrants | Armenia | 0.0 /100 | #335 | Tragic 6.2% |
| Pima | 0.0 /100 | #336 | Tragic 6.3% |
| Alaska Natives | 0.0 /100 | #337 | Tragic 6.3% |
| Immigrants | Azores | 0.0 /100 | #338 | Tragic 6.3% |
| Paiute | 0.0 /100 | #339 | Tragic 6.3% |
| Ute | 0.0 /100 | #340 | Tragic 6.3% |
| Yakama | 0.0 /100 | #341 | Tragic 6.7% |
| Navajo | 0.0 /100 | #342 | Tragic 6.7% |
| Tlingit-Haida | 0.0 /100 | #343 | Tragic 6.8% |
| Alaskan Athabascans | 0.0 /100 | #344 | Tragic 7.0% |
| Immigrants | Yemen | 0.0 /100 | #345 | Tragic 8.2% |
| Yup'ik | 0.0 /100 | #346 | Tragic 9.1% |
| Crow | 0.0 /100 | #347 | Tragic 16.9% |
Demographics Similar to Ecuadorians by Unemployment Among Seniors over 65 years
In terms of unemployment among seniors over 65 years, the demographic groups most similar to Ecuadorians are Mexican (5.6%, a difference of 0.040%), Portuguese (5.6%, a difference of 0.050%), Immigrants from St. Vincent and the Grenadines (5.6%, a difference of 0.14%), Liberian (5.6%, a difference of 0.21%), and Immigrants from Latin America (5.6%, a difference of 0.28%).
| Demographics | Rating | Rank | Unemployment Among Seniors over 65 years |
| Guyanese | 0.0 /100 | #299 | Tragic 5.6% |
| Zimbabweans | 0.0 /100 | #300 | Tragic 5.6% |
| Hispanics or Latinos | 0.0 /100 | #301 | Tragic 5.6% |
| Guatemalans | 0.0 /100 | #302 | Tragic 5.6% |
| Immigrants | Latin America | 0.0 /100 | #303 | Tragic 5.6% |
| Liberians | 0.0 /100 | #304 | Tragic 5.6% |
| Mexicans | 0.0 /100 | #305 | Tragic 5.6% |
| Ecuadorians | 0.0 /100 | #306 | Tragic 5.6% |
| Portuguese | 0.0 /100 | #307 | Tragic 5.6% |
| Immigrants | St. Vincent and the Grenadines | 0.0 /100 | #308 | Tragic 5.6% |
| Immigrants | Guatemala | 0.0 /100 | #309 | Tragic 5.6% |
| Salvadorans | 0.0 /100 | #310 | Tragic 5.6% |
| Immigrants | Guyana | 0.0 /100 | #311 | Tragic 5.6% |
| Immigrants | Ecuador | 0.0 /100 | #312 | Tragic 5.6% |
| Barbadians | 0.0 /100 | #313 | Tragic 5.6% |