Tlingit-Haida vs Ecuadorian Householder Income Ages 45 - 64 years
COMPARE
Tlingit-Haida
Ecuadorian
Householder Income Ages 45 - 64 years
Householder Income Ages 45 - 64 years Comparison
Tlingit-Haida
Ecuadorians
$97,417
HOUSEHOLDER INCOME AGES 45 - 64 YEARS
18.9/ 100
METRIC RATING
202nd/ 347
METRIC RANK
$93,739
HOUSEHOLDER INCOME AGES 45 - 64 YEARS
3.6/ 100
METRIC RATING
231st/ 347
METRIC RANK
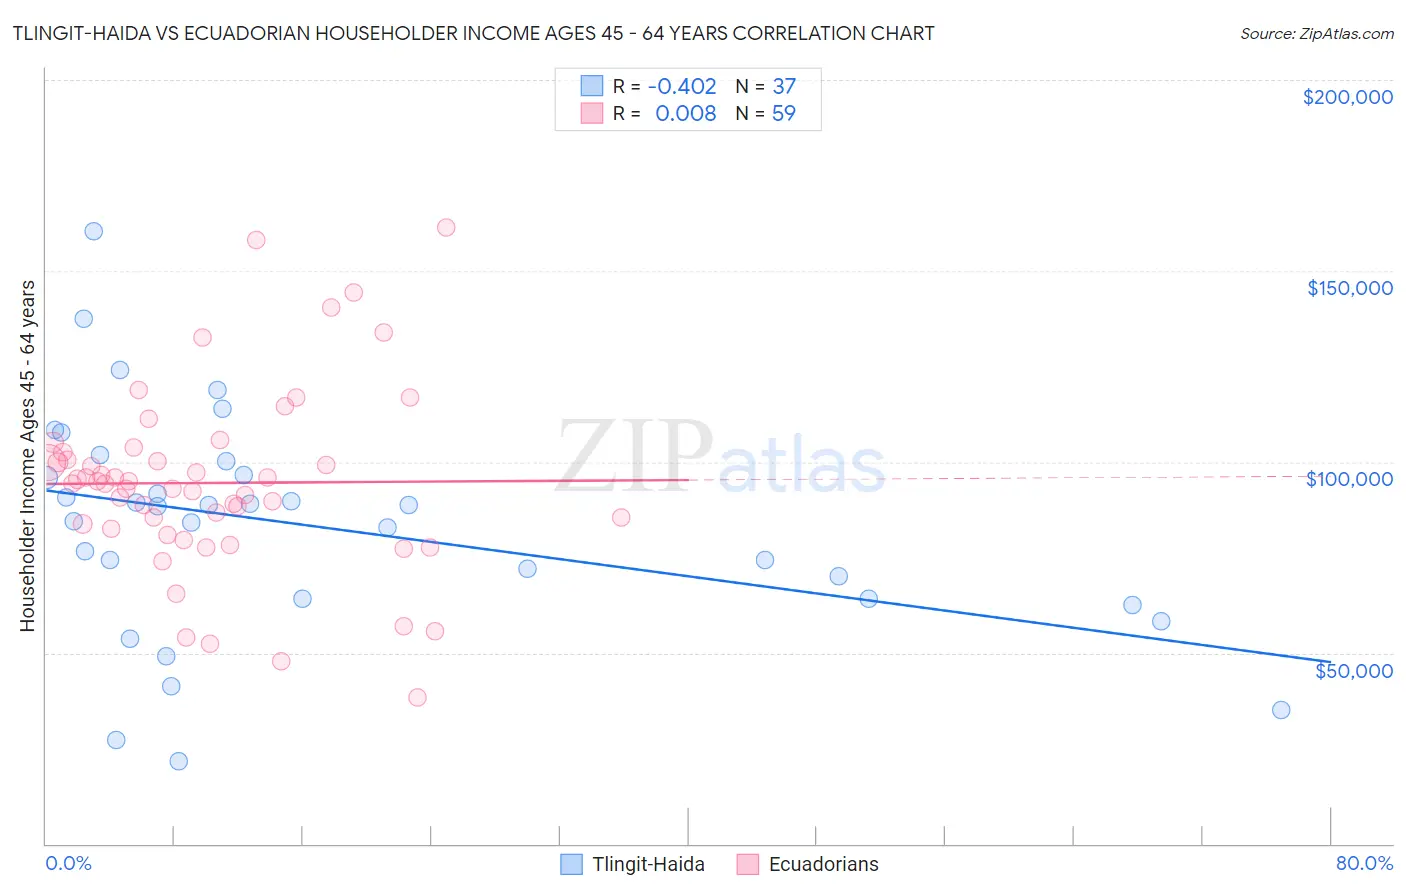
Tlingit-Haida vs Ecuadorian Householder Income Ages 45 - 64 years Correlation Chart
The statistical analysis conducted on geographies consisting of 60,826,750 people shows a moderate negative correlation between the proportion of Tlingit-Haida and household income with householder between the ages 45 and 64 in the United States with a correlation coefficient (R) of -0.402 and weighted average of $97,417. Similarly, the statistical analysis conducted on geographies consisting of 317,361,637 people shows no correlation between the proportion of Ecuadorians and household income with householder between the ages 45 and 64 in the United States with a correlation coefficient (R) of 0.008 and weighted average of $93,739, a difference of 3.9%.
Householder Income Ages 45 - 64 years Correlation Summary
| Measurement | Tlingit-Haida | Ecuadorian |
| Minimum | $21,563 | $38,250 |
| Maximum | $160,485 | $161,315 |
| Range | $138,922 | $123,065 |
| Mean | $83,137 | $94,502 |
| Median | $88,264 | $94,317 |
| Interquartile 25% (IQ1) | $64,077 | $82,422 |
| Interquartile 75% (IQ3) | $98,405 | $102,541 |
| Interquartile Range (IQR) | $34,328 | $20,119 |
| Standard Deviation (Sample) | $29,197 | $24,241 |
| Standard Deviation (Population) | $28,800 | $24,034 |
Similar Demographics by Householder Income Ages 45 - 64 years
Demographics Similar to Tlingit-Haida by Householder Income Ages 45 - 64 years
In terms of householder income ages 45 - 64 years, the demographic groups most similar to Tlingit-Haida are Immigrants from Thailand ($97,400, a difference of 0.020%), Immigrants from Eritrea ($97,373, a difference of 0.040%), Immigrants from Colombia ($97,290, a difference of 0.13%), Immigrants from Africa ($97,284, a difference of 0.14%), and Ghanaian ($97,277, a difference of 0.14%).
| Demographics | Rating | Rank | Householder Income Ages 45 - 64 years |
| Spanish | 29.2 /100 | #195 | Fair $98,554 |
| Immigrants | Eastern Africa | 28.3 /100 | #196 | Fair $98,467 |
| Puget Sound Salish | 27.0 /100 | #197 | Fair $98,340 |
| Immigrants | Iraq | 25.7 /100 | #198 | Fair $98,201 |
| Whites/Caucasians | 24.6 /100 | #199 | Fair $98,091 |
| Immigrants | Kenya | 23.5 /100 | #200 | Fair $97,964 |
| Yugoslavians | 20.0 /100 | #201 | Fair $97,558 |
| Tlingit-Haida | 18.9 /100 | #202 | Poor $97,417 |
| Immigrants | Thailand | 18.8 /100 | #203 | Poor $97,400 |
| Immigrants | Eritrea | 18.6 /100 | #204 | Poor $97,373 |
| Immigrants | Colombia | 18.0 /100 | #205 | Poor $97,290 |
| Immigrants | Africa | 17.9 /100 | #206 | Poor $97,284 |
| Ghanaians | 17.9 /100 | #207 | Poor $97,277 |
| Scotch-Irish | 16.4 /100 | #208 | Poor $97,073 |
| Japanese | 14.8 /100 | #209 | Poor $96,834 |
Demographics Similar to Ecuadorians by Householder Income Ages 45 - 64 years
In terms of householder income ages 45 - 64 years, the demographic groups most similar to Ecuadorians are Sudanese ($93,718, a difference of 0.020%), Immigrants from Sudan ($93,781, a difference of 0.040%), Vietnamese ($93,788, a difference of 0.050%), Immigrants from Panama ($93,815, a difference of 0.080%), and Alaska Native ($93,991, a difference of 0.27%).
| Demographics | Rating | Rank | Householder Income Ages 45 - 64 years |
| Immigrants | Bosnia and Herzegovina | 4.6 /100 | #224 | Tragic $94,288 |
| Bermudans | 4.4 /100 | #225 | Tragic $94,197 |
| Immigrants | Azores | 4.3 /100 | #226 | Tragic $94,138 |
| Alaska Natives | 4.0 /100 | #227 | Tragic $93,991 |
| Immigrants | Panama | 3.7 /100 | #228 | Tragic $93,815 |
| Vietnamese | 3.6 /100 | #229 | Tragic $93,788 |
| Immigrants | Sudan | 3.6 /100 | #230 | Tragic $93,781 |
| Ecuadorians | 3.6 /100 | #231 | Tragic $93,739 |
| Sudanese | 3.5 /100 | #232 | Tragic $93,718 |
| Nepalese | 3.0 /100 | #233 | Tragic $93,355 |
| Immigrants | El Salvador | 2.7 /100 | #234 | Tragic $93,176 |
| Nicaraguans | 2.0 /100 | #235 | Tragic $92,554 |
| Immigrants | Western Africa | 1.8 /100 | #236 | Tragic $92,384 |
| Immigrants | Bangladesh | 1.7 /100 | #237 | Tragic $92,208 |
| Pennsylvania Germans | 1.5 /100 | #238 | Tragic $91,956 |