Sudanese vs African Unemployment Among Seniors over 65 years
COMPARE
Sudanese
African
Unemployment Among Seniors over 65 years
Unemployment Among Seniors over 65 years Comparison
Sudanese
Africans
4.4%
UNEMPLOYMENT AMONG SENIORS OVER 65 YEARS
100.0/ 100
METRIC RATING
4th/ 347
METRIC RANK
5.2%
UNEMPLOYMENT AMONG SENIORS OVER 65 YEARS
10.4/ 100
METRIC RATING
211th/ 347
METRIC RANK
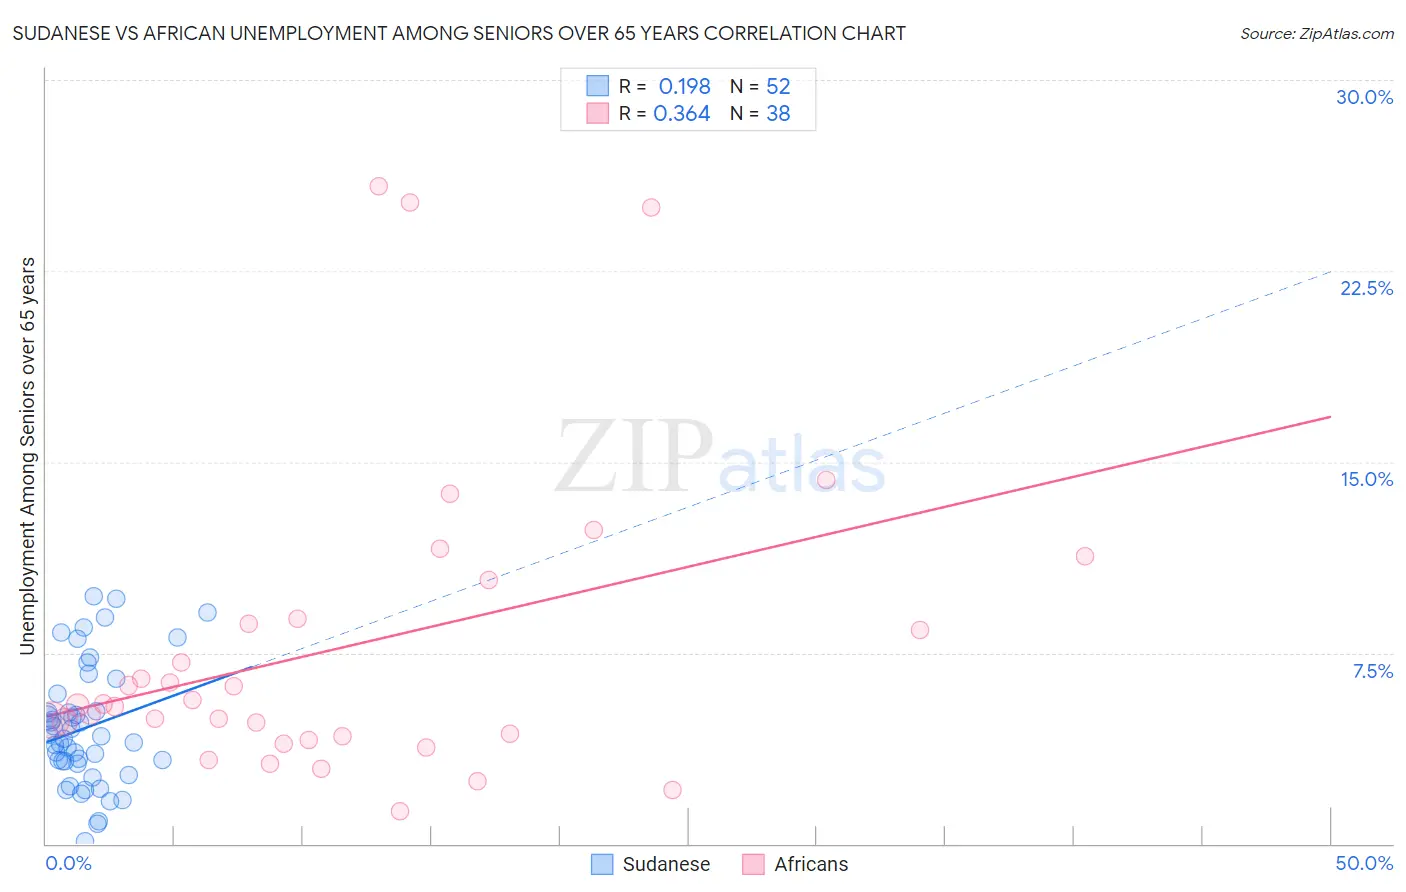
Sudanese vs African Unemployment Among Seniors over 65 years Correlation Chart
The statistical analysis conducted on geographies consisting of 105,958,134 people shows a poor positive correlation between the proportion of Sudanese and unemployment rate amomg seniors over the age of 65 in the United States with a correlation coefficient (R) of 0.198 and weighted average of 4.4%. Similarly, the statistical analysis conducted on geographies consisting of 410,830,354 people shows a mild positive correlation between the proportion of Africans and unemployment rate amomg seniors over the age of 65 in the United States with a correlation coefficient (R) of 0.364 and weighted average of 5.2%, a difference of 18.9%.
Unemployment Among Seniors over 65 years Correlation Summary
| Measurement | Sudanese | African |
| Minimum | 0.10% | 1.3% |
| Maximum | 9.7% | 25.8% |
| Range | 9.6% | 24.5% |
| Mean | 4.6% | 7.8% |
| Median | 4.2% | 5.5% |
| Interquartile 25% (IQ1) | 3.2% | 4.2% |
| Interquartile 75% (IQ3) | 5.5% | 8.9% |
| Interquartile Range (IQR) | 2.3% | 4.6% |
| Standard Deviation (Sample) | 2.4% | 6.1% |
| Standard Deviation (Population) | 2.4% | 6.0% |
Similar Demographics by Unemployment Among Seniors over 65 years
Demographics Similar to Sudanese by Unemployment Among Seniors over 65 years
In terms of unemployment among seniors over 65 years, the demographic groups most similar to Sudanese are Chickasaw (4.4%, a difference of 0.080%), Immigrants from Cuba (4.5%, a difference of 1.3%), Immigrants from Congo (4.5%, a difference of 2.1%), Tsimshian (4.5%, a difference of 2.7%), and Indonesian (4.5%, a difference of 3.2%).
| Demographics | Rating | Rank | Unemployment Among Seniors over 65 years |
| Chinese | 100.0 /100 | #1 | Exceptional 4.2% |
| Hmong | 100.0 /100 | #2 | Exceptional 4.2% |
| Fijians | 100.0 /100 | #3 | Exceptional 4.2% |
| Sudanese | 100.0 /100 | #4 | Exceptional 4.4% |
| Chickasaw | 100.0 /100 | #5 | Exceptional 4.4% |
| Immigrants | Cuba | 100.0 /100 | #6 | Exceptional 4.5% |
| Immigrants | Congo | 100.0 /100 | #7 | Exceptional 4.5% |
| Tsimshian | 100.0 /100 | #8 | Exceptional 4.5% |
| Indonesians | 100.0 /100 | #9 | Exceptional 4.5% |
| Immigrants | Zaire | 100.0 /100 | #10 | Exceptional 4.5% |
| Comanche | 100.0 /100 | #11 | Exceptional 4.6% |
| Osage | 100.0 /100 | #12 | Exceptional 4.6% |
| Cubans | 100.0 /100 | #13 | Exceptional 4.6% |
| Menominee | 100.0 /100 | #14 | Exceptional 4.6% |
| Lumbee | 100.0 /100 | #15 | Exceptional 4.6% |
Demographics Similar to Africans by Unemployment Among Seniors over 65 years
In terms of unemployment among seniors over 65 years, the demographic groups most similar to Africans are Immigrants from Honduras (5.2%, a difference of 0.010%), Immigrants from Uzbekistan (5.2%, a difference of 0.030%), Alsatian (5.2%, a difference of 0.080%), Immigrants from Uruguay (5.2%, a difference of 0.090%), and Albanian (5.2%, a difference of 0.12%).
| Demographics | Rating | Rank | Unemployment Among Seniors over 65 years |
| Immigrants | China | 16.9 /100 | #204 | Poor 5.2% |
| South American Indians | 15.3 /100 | #205 | Poor 5.2% |
| German Russians | 14.7 /100 | #206 | Poor 5.2% |
| Immigrants | Philippines | 13.2 /100 | #207 | Poor 5.2% |
| Uruguayans | 12.6 /100 | #208 | Poor 5.2% |
| Alsatians | 11.4 /100 | #209 | Poor 5.2% |
| Immigrants | Uzbekistan | 10.7 /100 | #210 | Poor 5.2% |
| Africans | 10.4 /100 | #211 | Poor 5.2% |
| Immigrants | Honduras | 10.2 /100 | #212 | Poor 5.2% |
| Immigrants | Uruguay | 9.3 /100 | #213 | Tragic 5.2% |
| Albanians | 9.1 /100 | #214 | Tragic 5.2% |
| Immigrants | Fiji | 8.6 /100 | #215 | Tragic 5.2% |
| Cajuns | 8.5 /100 | #216 | Tragic 5.2% |
| Italians | 8.3 /100 | #217 | Tragic 5.2% |
| Spaniards | 7.4 /100 | #218 | Tragic 5.2% |