Immigrants from Cabo Verde vs African Married-Couple Family Poverty
COMPARE
Immigrants from Cabo Verde
African
Married-Couple Family Poverty
Married-Couple Family Poverty Comparison
Immigrants from Cabo Verde
Africans
5.3%
MARRIED-COUPLE FAMILY POVERTY
30.9/ 100
METRIC RATING
191st/ 347
METRIC RANK
6.0%
MARRIED-COUPLE FAMILY POVERTY
0.7/ 100
METRIC RATING
253rd/ 347
METRIC RANK
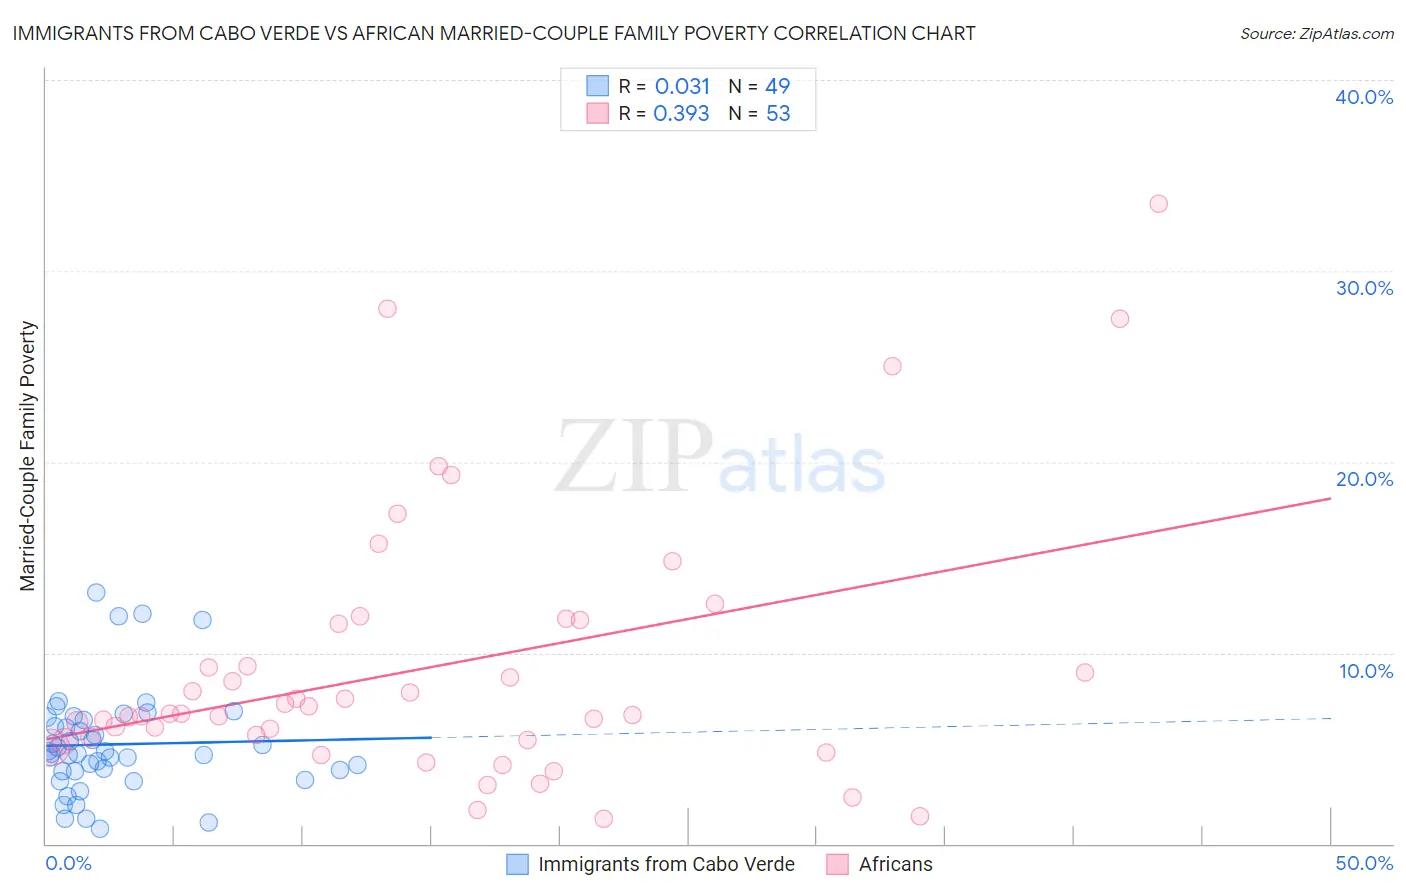
Immigrants from Cabo Verde vs African Married-Couple Family Poverty Correlation Chart
The statistical analysis conducted on geographies consisting of 38,016,283 people shows no correlation between the proportion of Immigrants from Cabo Verde and poverty level among married-couple families in the United States with a correlation coefficient (R) of 0.031 and weighted average of 5.3%. Similarly, the statistical analysis conducted on geographies consisting of 465,332,891 people shows a mild positive correlation between the proportion of Africans and poverty level among married-couple families in the United States with a correlation coefficient (R) of 0.393 and weighted average of 6.0%, a difference of 11.7%.
Married-Couple Family Poverty Correlation Summary
| Measurement | Immigrants from Cabo Verde | African |
| Minimum | 0.81% | 1.3% |
| Maximum | 13.1% | 33.5% |
| Range | 12.3% | 32.2% |
| Mean | 5.2% | 9.3% |
| Median | 4.7% | 6.8% |
| Interquartile 25% (IQ1) | 3.8% | 5.4% |
| Interquartile 75% (IQ3) | 6.6% | 11.6% |
| Interquartile Range (IQR) | 2.8% | 6.2% |
| Standard Deviation (Sample) | 2.7% | 7.0% |
| Standard Deviation (Population) | 2.7% | 6.9% |
Similar Demographics by Married-Couple Family Poverty
Demographics Similar to Immigrants from Cabo Verde by Married-Couple Family Poverty
In terms of married-couple family poverty, the demographic groups most similar to Immigrants from Cabo Verde are Cape Verdean (5.3%, a difference of 0.030%), Ugandan (5.3%, a difference of 0.090%), Malaysian (5.4%, a difference of 0.19%), South American Indian (5.3%, a difference of 0.20%), and Israeli (5.3%, a difference of 0.29%).
| Demographics | Rating | Rank | Married-Couple Family Poverty |
| Immigrants | Nonimmigrants | 35.8 /100 | #184 | Fair 5.3% |
| Americans | 35.4 /100 | #185 | Fair 5.3% |
| Hungarians | 34.7 /100 | #186 | Fair 5.3% |
| Immigrants | Albania | 33.8 /100 | #187 | Fair 5.3% |
| Israelis | 33.1 /100 | #188 | Fair 5.3% |
| South American Indians | 32.5 /100 | #189 | Fair 5.3% |
| Ugandans | 31.6 /100 | #190 | Fair 5.3% |
| Immigrants | Cabo Verde | 30.9 /100 | #191 | Fair 5.3% |
| Cape Verdeans | 30.7 /100 | #192 | Fair 5.3% |
| Malaysians | 29.5 /100 | #193 | Fair 5.4% |
| Immigrants | Israel | 27.8 /100 | #194 | Fair 5.4% |
| Immigrants | Azores | 27.5 /100 | #195 | Fair 5.4% |
| Spaniards | 27.4 /100 | #196 | Fair 5.4% |
| Liberians | 26.3 /100 | #197 | Fair 5.4% |
| Immigrants | Belarus | 26.2 /100 | #198 | Fair 5.4% |
Demographics Similar to Africans by Married-Couple Family Poverty
In terms of married-couple family poverty, the demographic groups most similar to Africans are Immigrants from Somalia (6.0%, a difference of 0.060%), Immigrants from Western Asia (6.0%, a difference of 0.090%), Comanche (6.0%, a difference of 0.21%), Bangladeshi (6.0%, a difference of 0.71%), and Immigrants from Ghana (5.9%, a difference of 0.73%).
| Demographics | Rating | Rank | Married-Couple Family Poverty |
| Immigrants | Venezuela | 1.8 /100 | #246 | Tragic 5.8% |
| Iraqis | 1.4 /100 | #247 | Tragic 5.9% |
| Cree | 1.2 /100 | #248 | Tragic 5.9% |
| Tsimshian | 1.1 /100 | #249 | Tragic 5.9% |
| Immigrants | Eritrea | 1.1 /100 | #250 | Tragic 5.9% |
| Immigrants | Ghana | 1.0 /100 | #251 | Tragic 5.9% |
| Immigrants | Western Asia | 0.7 /100 | #252 | Tragic 6.0% |
| Africans | 0.7 /100 | #253 | Tragic 6.0% |
| Immigrants | Somalia | 0.7 /100 | #254 | Tragic 6.0% |
| Comanche | 0.7 /100 | #255 | Tragic 6.0% |
| Bangladeshis | 0.5 /100 | #256 | Tragic 6.0% |
| Immigrants | Burma/Myanmar | 0.5 /100 | #257 | Tragic 6.0% |
| Immigrants | Immigrants | 0.5 /100 | #258 | Tragic 6.0% |
| Alaskan Athabascans | 0.4 /100 | #259 | Tragic 6.1% |
| Jamaicans | 0.3 /100 | #260 | Tragic 6.1% |