Subsaharan African vs Chippewa Child Poverty Among Girls Under 16
COMPARE
Subsaharan African
Chippewa
Child Poverty Among Girls Under 16
Child Poverty Among Girls Under 16 Comparison
Sub-Saharan Africans
Chippewa
20.1%
CHILD POVERTY AMONG GIRLS UNDER 16
0.0/ 100
METRIC RATING
275th/ 347
METRIC RANK
20.6%
CHILD POVERTY AMONG GIRLS UNDER 16
0.0/ 100
METRIC RATING
291st/ 347
METRIC RANK
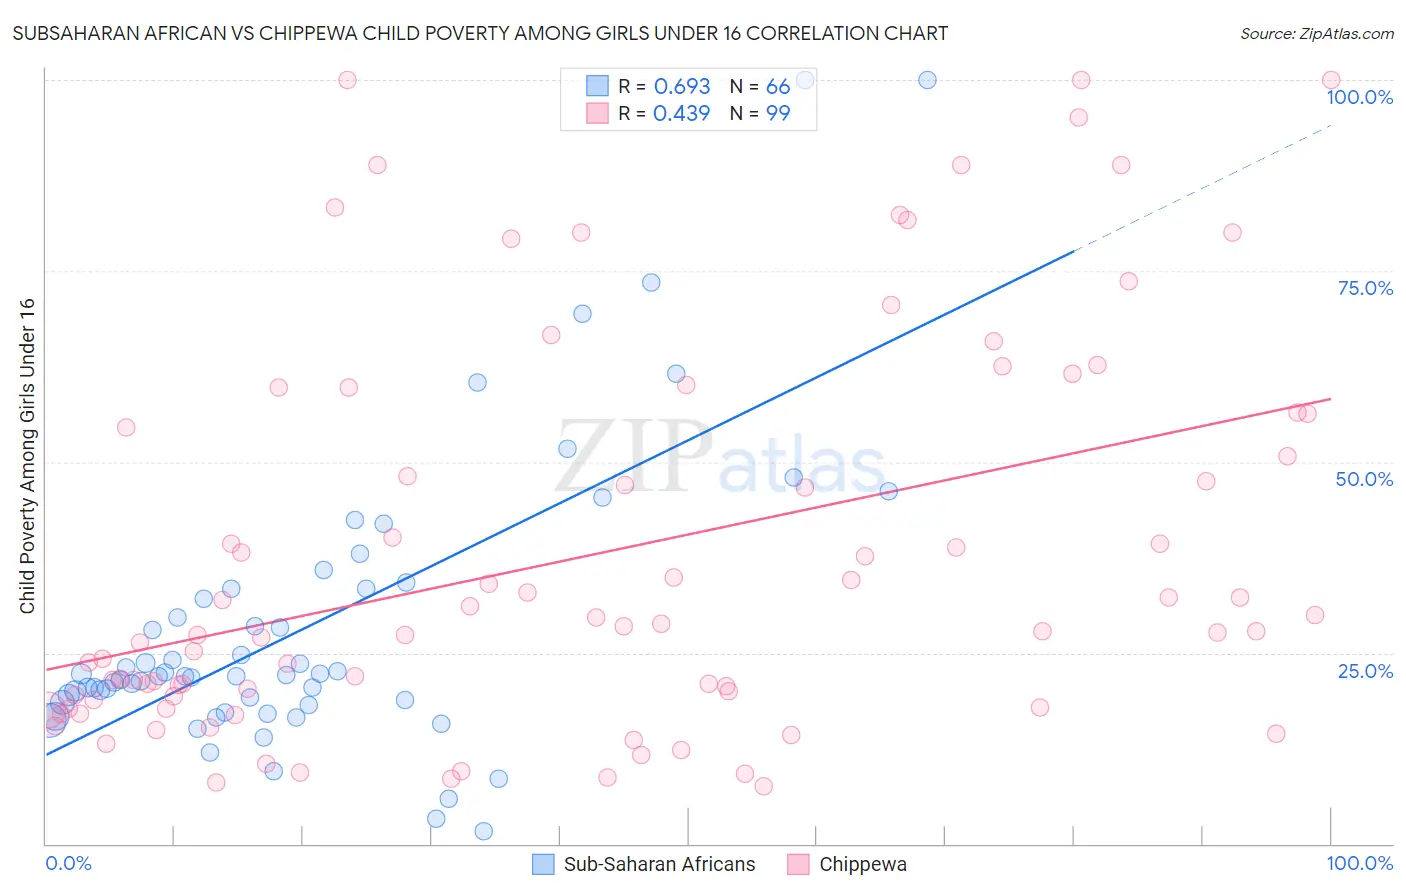
Subsaharan African vs Chippewa Child Poverty Among Girls Under 16 Correlation Chart
The statistical analysis conducted on geographies consisting of 496,899,151 people shows a significant positive correlation between the proportion of Sub-Saharan Africans and poverty level among girls under the age of 16 in the United States with a correlation coefficient (R) of 0.693 and weighted average of 20.1%. Similarly, the statistical analysis conducted on geographies consisting of 212,813,465 people shows a moderate positive correlation between the proportion of Chippewa and poverty level among girls under the age of 16 in the United States with a correlation coefficient (R) of 0.439 and weighted average of 20.6%, a difference of 2.6%.
Child Poverty Among Girls Under 16 Correlation Summary
| Measurement | Subsaharan African | Chippewa |
| Minimum | 1.7% | 7.5% |
| Maximum | 100.0% | 100.0% |
| Range | 98.3% | 92.5% |
| Mean | 28.3% | 37.7% |
| Median | 21.9% | 27.8% |
| Interquartile 25% (IQ1) | 18.5% | 18.9% |
| Interquartile 75% (IQ3) | 33.3% | 56.3% |
| Interquartile Range (IQR) | 14.8% | 37.5% |
| Standard Deviation (Sample) | 19.2% | 25.5% |
| Standard Deviation (Population) | 19.1% | 25.4% |
Demographics Similar to Sub-Saharan Africans and Chippewa by Child Poverty Among Girls Under 16
In terms of child poverty among girls under 16, the demographic groups most similar to Sub-Saharan Africans are Immigrants from St. Vincent and the Grenadines (20.1%, a difference of 0.14%), Comanche (20.2%, a difference of 0.32%), Belizean (20.2%, a difference of 0.43%), Barbadian (20.2%, a difference of 0.46%), and Bangladeshi (20.0%, a difference of 0.57%). Similarly, the demographic groups most similar to Chippewa are Immigrants from Latin America (20.6%, a difference of 0.070%), Immigrants from Grenada (20.7%, a difference of 0.11%), Immigrants from Haiti (20.6%, a difference of 0.13%), Immigrants from Belize (20.6%, a difference of 0.20%), and Haitian (20.5%, a difference of 0.67%).
| Demographics | Rating | Rank | Child Poverty Among Girls Under 16 |
| Bangladeshis | 0.1 /100 | #273 | Tragic 20.0% |
| Immigrants | St. Vincent and the Grenadines | 0.0 /100 | #274 | Tragic 20.1% |
| Sub-Saharan Africans | 0.0 /100 | #275 | Tragic 20.1% |
| Comanche | 0.0 /100 | #276 | Tragic 20.2% |
| Belizeans | 0.0 /100 | #277 | Tragic 20.2% |
| Barbadians | 0.0 /100 | #278 | Tragic 20.2% |
| Immigrants | Zaire | 0.0 /100 | #279 | Tragic 20.2% |
| Immigrants | Liberia | 0.0 /100 | #280 | Tragic 20.2% |
| Central Americans | 0.0 /100 | #281 | Tragic 20.2% |
| West Indians | 0.0 /100 | #282 | Tragic 20.3% |
| Senegalese | 0.0 /100 | #283 | Tragic 20.3% |
| Yaqui | 0.0 /100 | #284 | Tragic 20.3% |
| Immigrants | Cabo Verde | 0.0 /100 | #285 | Tragic 20.3% |
| Iroquois | 0.0 /100 | #286 | Tragic 20.4% |
| Blackfeet | 0.0 /100 | #287 | Tragic 20.5% |
| Haitians | 0.0 /100 | #288 | Tragic 20.5% |
| Immigrants | Belize | 0.0 /100 | #289 | Tragic 20.6% |
| Immigrants | Haiti | 0.0 /100 | #290 | Tragic 20.6% |
| Chippewa | 0.0 /100 | #291 | Tragic 20.6% |
| Immigrants | Latin America | 0.0 /100 | #292 | Tragic 20.6% |
| Immigrants | Grenada | 0.0 /100 | #293 | Tragic 20.7% |