Immigrants from Burma/Myanmar vs Samoan Child Poverty Among Girls Under 16
COMPARE
Immigrants from Burma/Myanmar
Samoan
Child Poverty Among Girls Under 16
Child Poverty Among Girls Under 16 Comparison
Immigrants from Burma/Myanmar
Samoans
19.7%
CHILD POVERTY AMONG GIRLS UNDER 16
0.1/ 100
METRIC RATING
263rd/ 347
METRIC RANK
15.7%
CHILD POVERTY AMONG GIRLS UNDER 16
84.2/ 100
METRIC RATING
146th/ 347
METRIC RANK
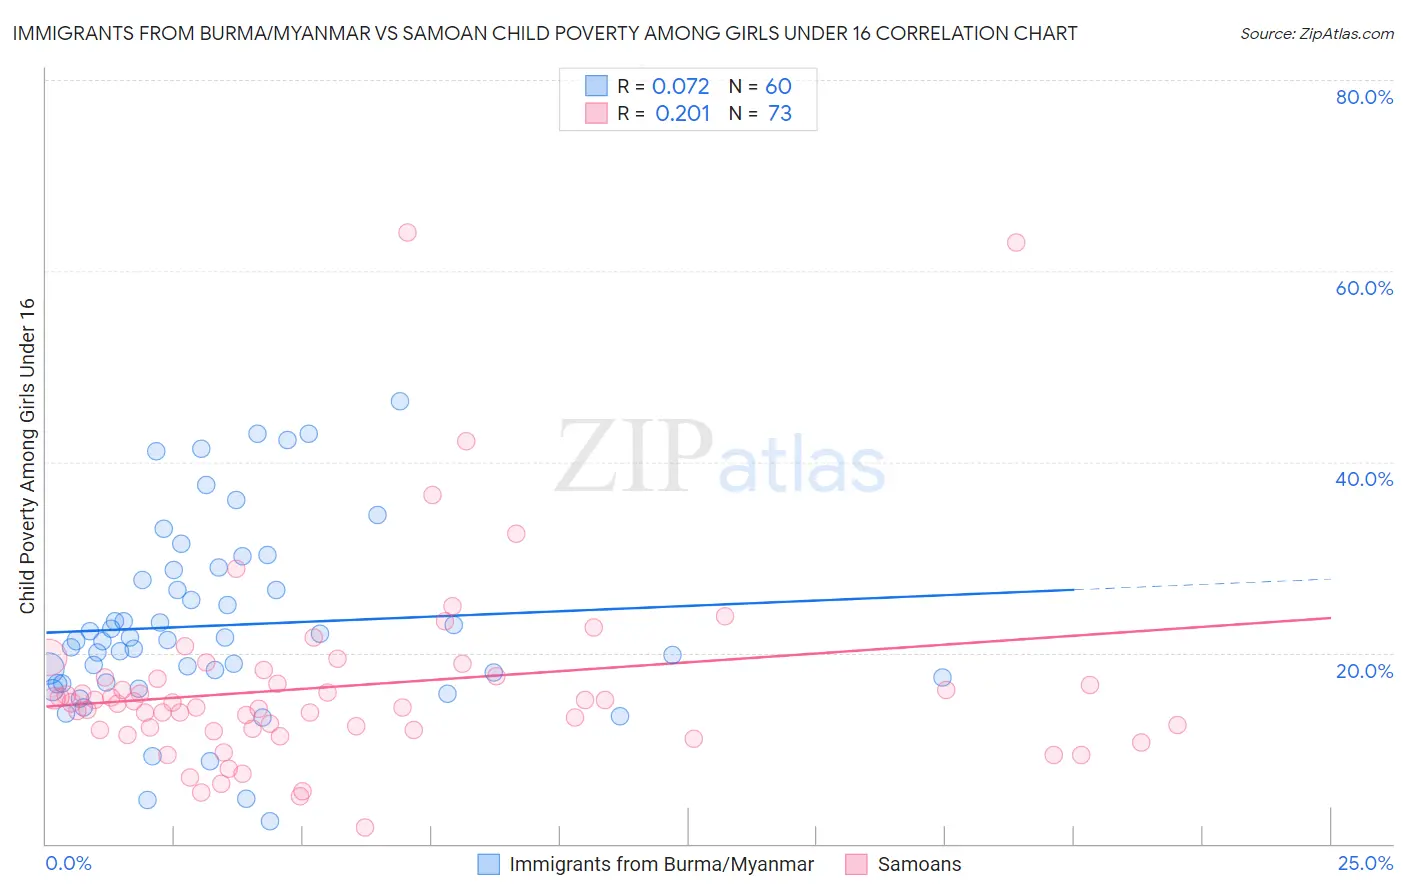
Immigrants from Burma/Myanmar vs Samoan Child Poverty Among Girls Under 16 Correlation Chart
The statistical analysis conducted on geographies consisting of 171,314,944 people shows a slight positive correlation between the proportion of Immigrants from Burma/Myanmar and poverty level among girls under the age of 16 in the United States with a correlation coefficient (R) of 0.072 and weighted average of 19.7%. Similarly, the statistical analysis conducted on geographies consisting of 223,807,400 people shows a weak positive correlation between the proportion of Samoans and poverty level among girls under the age of 16 in the United States with a correlation coefficient (R) of 0.201 and weighted average of 15.7%, a difference of 25.4%.
Child Poverty Among Girls Under 16 Correlation Summary
| Measurement | Immigrants from Burma/Myanmar | Samoan |
| Minimum | 2.4% | 1.7% |
| Maximum | 46.4% | 64.0% |
| Range | 44.0% | 62.3% |
| Mean | 22.9% | 16.5% |
| Median | 21.3% | 14.8% |
| Interquartile 25% (IQ1) | 16.8% | 11.9% |
| Interquartile 75% (IQ3) | 28.2% | 17.5% |
| Interquartile Range (IQR) | 11.3% | 5.5% |
| Standard Deviation (Sample) | 9.8% | 10.3% |
| Standard Deviation (Population) | 9.7% | 10.3% |
Similar Demographics by Child Poverty Among Girls Under 16
Demographics Similar to Immigrants from Burma/Myanmar by Child Poverty Among Girls Under 16
In terms of child poverty among girls under 16, the demographic groups most similar to Immigrants from Burma/Myanmar are Jamaican (19.7%, a difference of 0.11%), Chickasaw (19.6%, a difference of 0.12%), Immigrants from Jamaica (19.8%, a difference of 0.55%), Vietnamese (19.5%, a difference of 0.64%), and Mexican American Indian (19.5%, a difference of 0.73%).
| Demographics | Rating | Rank | Child Poverty Among Girls Under 16 |
| Trinidadians and Tobagonians | 0.2 /100 | #256 | Tragic 19.3% |
| Guyanese | 0.2 /100 | #257 | Tragic 19.4% |
| Salvadorans | 0.2 /100 | #258 | Tragic 19.4% |
| Ottawa | 0.2 /100 | #259 | Tragic 19.4% |
| Mexican American Indians | 0.2 /100 | #260 | Tragic 19.5% |
| Vietnamese | 0.2 /100 | #261 | Tragic 19.5% |
| Chickasaw | 0.1 /100 | #262 | Tragic 19.6% |
| Immigrants | Burma/Myanmar | 0.1 /100 | #263 | Tragic 19.7% |
| Jamaicans | 0.1 /100 | #264 | Tragic 19.7% |
| Immigrants | Jamaica | 0.1 /100 | #265 | Tragic 19.8% |
| Spanish Americans | 0.1 /100 | #266 | Tragic 19.8% |
| Immigrants | Bangladesh | 0.1 /100 | #267 | Tragic 19.9% |
| Spanish American Indians | 0.1 /100 | #268 | Tragic 19.9% |
| Liberians | 0.1 /100 | #269 | Tragic 19.9% |
| Cherokee | 0.1 /100 | #270 | Tragic 19.9% |
Demographics Similar to Samoans by Child Poverty Among Girls Under 16
In terms of child poverty among girls under 16, the demographic groups most similar to Samoans are Slavic (15.7%, a difference of 0.23%), Welsh (15.6%, a difference of 0.29%), Icelander (15.7%, a difference of 0.38%), Israeli (15.6%, a difference of 0.50%), and Immigrants from Peru (15.6%, a difference of 0.59%).
| Demographics | Rating | Rank | Child Poverty Among Girls Under 16 |
| Armenians | 87.9 /100 | #139 | Excellent 15.5% |
| New Zealanders | 87.2 /100 | #140 | Excellent 15.6% |
| Immigrants | Jordan | 87.2 /100 | #141 | Excellent 15.6% |
| Canadians | 87.1 /100 | #142 | Excellent 15.6% |
| Immigrants | Peru | 86.6 /100 | #143 | Excellent 15.6% |
| Israelis | 86.3 /100 | #144 | Excellent 15.6% |
| Welsh | 85.4 /100 | #145 | Excellent 15.6% |
| Samoans | 84.2 /100 | #146 | Excellent 15.7% |
| Slavs | 83.1 /100 | #147 | Excellent 15.7% |
| Icelanders | 82.4 /100 | #148 | Excellent 15.7% |
| Immigrants | Hungary | 80.9 /100 | #149 | Excellent 15.8% |
| Immigrants | Albania | 80.7 /100 | #150 | Excellent 15.8% |
| Venezuelans | 80.1 /100 | #151 | Excellent 15.8% |
| Immigrants | Kuwait | 79.4 /100 | #152 | Good 15.8% |
| Immigrants | Nepal | 78.5 /100 | #153 | Good 15.9% |