Subsaharan African vs Russian Child Poverty Among Girls Under 16
COMPARE
Subsaharan African
Russian
Child Poverty Among Girls Under 16
Child Poverty Among Girls Under 16 Comparison
Sub-Saharan Africans
Russians
20.1%
CHILD POVERTY AMONG GIRLS UNDER 16
0.0/ 100
METRIC RATING
275th/ 347
METRIC RANK
13.9%
CHILD POVERTY AMONG GIRLS UNDER 16
99.6/ 100
METRIC RATING
36th/ 347
METRIC RANK
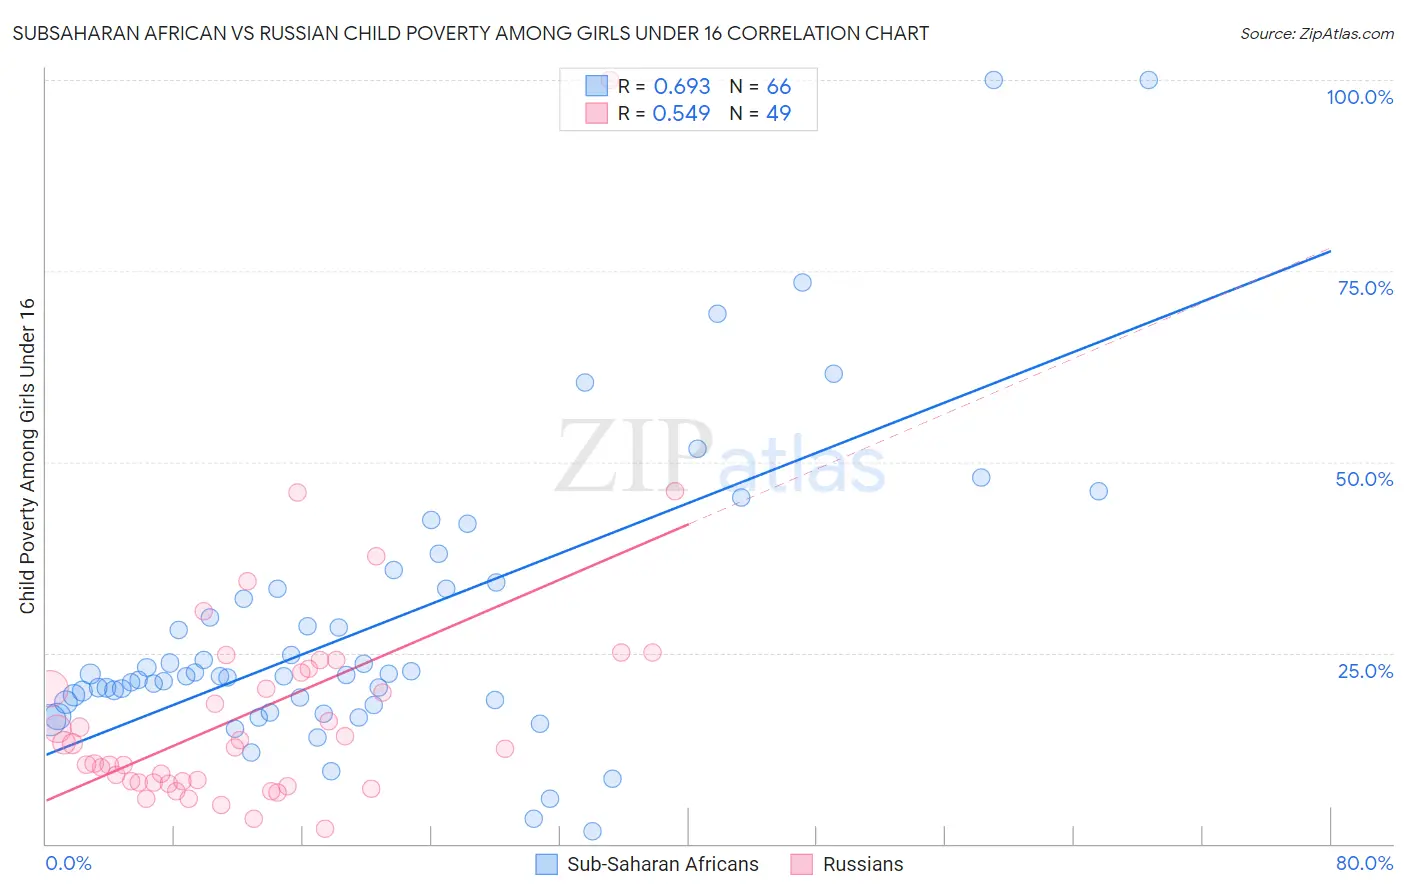
Subsaharan African vs Russian Child Poverty Among Girls Under 16 Correlation Chart
The statistical analysis conducted on geographies consisting of 496,899,151 people shows a significant positive correlation between the proportion of Sub-Saharan Africans and poverty level among girls under the age of 16 in the United States with a correlation coefficient (R) of 0.693 and weighted average of 20.1%. Similarly, the statistical analysis conducted on geographies consisting of 495,383,256 people shows a substantial positive correlation between the proportion of Russians and poverty level among girls under the age of 16 in the United States with a correlation coefficient (R) of 0.549 and weighted average of 13.9%, a difference of 45.1%.
Child Poverty Among Girls Under 16 Correlation Summary
| Measurement | Subsaharan African | Russian |
| Minimum | 1.7% | 1.9% |
| Maximum | 100.0% | 100.0% |
| Range | 98.3% | 98.1% |
| Mean | 28.3% | 17.2% |
| Median | 21.9% | 12.5% |
| Interquartile 25% (IQ1) | 18.5% | 8.0% |
| Interquartile 75% (IQ3) | 33.3% | 22.6% |
| Interquartile Range (IQR) | 14.8% | 14.6% |
| Standard Deviation (Sample) | 19.2% | 15.9% |
| Standard Deviation (Population) | 19.1% | 15.7% |
Similar Demographics by Child Poverty Among Girls Under 16
Demographics Similar to Sub-Saharan Africans by Child Poverty Among Girls Under 16
In terms of child poverty among girls under 16, the demographic groups most similar to Sub-Saharan Africans are Immigrants from St. Vincent and the Grenadines (20.1%, a difference of 0.14%), Comanche (20.2%, a difference of 0.32%), Belizean (20.2%, a difference of 0.43%), Barbadian (20.2%, a difference of 0.46%), and Bangladeshi (20.0%, a difference of 0.57%).
| Demographics | Rating | Rank | Child Poverty Among Girls Under 16 |
| Spanish American Indians | 0.1 /100 | #268 | Tragic 19.9% |
| Liberians | 0.1 /100 | #269 | Tragic 19.9% |
| Cherokee | 0.1 /100 | #270 | Tragic 19.9% |
| Immigrants | Barbados | 0.1 /100 | #271 | Tragic 19.9% |
| Immigrants | El Salvador | 0.1 /100 | #272 | Tragic 20.0% |
| Bangladeshis | 0.1 /100 | #273 | Tragic 20.0% |
| Immigrants | St. Vincent and the Grenadines | 0.0 /100 | #274 | Tragic 20.1% |
| Sub-Saharan Africans | 0.0 /100 | #275 | Tragic 20.1% |
| Comanche | 0.0 /100 | #276 | Tragic 20.2% |
| Belizeans | 0.0 /100 | #277 | Tragic 20.2% |
| Barbadians | 0.0 /100 | #278 | Tragic 20.2% |
| Immigrants | Zaire | 0.0 /100 | #279 | Tragic 20.2% |
| Immigrants | Liberia | 0.0 /100 | #280 | Tragic 20.2% |
| Central Americans | 0.0 /100 | #281 | Tragic 20.2% |
| West Indians | 0.0 /100 | #282 | Tragic 20.3% |
Demographics Similar to Russians by Child Poverty Among Girls Under 16
In terms of child poverty among girls under 16, the demographic groups most similar to Russians are Lithuanian (13.9%, a difference of 0.020%), Immigrants from Northern Europe (13.8%, a difference of 0.15%), Immigrants from Moldova (13.9%, a difference of 0.32%), Immigrants from Australia (14.0%, a difference of 0.97%), and Immigrants from Sri Lanka (14.0%, a difference of 1.1%).
| Demographics | Rating | Rank | Child Poverty Among Girls Under 16 |
| Bolivians | 99.8 /100 | #29 | Exceptional 13.6% |
| Asians | 99.7 /100 | #30 | Exceptional 13.7% |
| Turks | 99.7 /100 | #31 | Exceptional 13.7% |
| Danes | 99.7 /100 | #32 | Exceptional 13.7% |
| Swedes | 99.7 /100 | #33 | Exceptional 13.7% |
| Maltese | 99.7 /100 | #34 | Exceptional 13.7% |
| Immigrants | Northern Europe | 99.6 /100 | #35 | Exceptional 13.8% |
| Russians | 99.6 /100 | #36 | Exceptional 13.9% |
| Lithuanians | 99.6 /100 | #37 | Exceptional 13.9% |
| Immigrants | Moldova | 99.6 /100 | #38 | Exceptional 13.9% |
| Immigrants | Australia | 99.5 /100 | #39 | Exceptional 14.0% |
| Immigrants | Sri Lanka | 99.5 /100 | #40 | Exceptional 14.0% |
| Immigrants | Bolivia | 99.5 /100 | #41 | Exceptional 14.0% |
| Immigrants | Scotland | 99.4 /100 | #42 | Exceptional 14.0% |
| Koreans | 99.4 /100 | #43 | Exceptional 14.1% |