Cheyenne vs Samoan Child Poverty Among Girls Under 16

COMPARE

Cheyenne
Race
Ancestry
AfghanAfricanAlaska NativeAlaskan AthabascanAlbanianAleutAlsatianAmericanApacheArabArapahoArgentineanArmenianAssyrian/Chaldean/SyriacAustralianAustrianBahamianBangladeshiBarbadianBasqueBelgianBelizeanBermudanBhutaneseBlackfeetBolivianBrazilianBritishBritish West IndianBulgarianBurmeseCajunCambodianCanadianCape VerdeanCarpatho RusynCelticCentral AmericanCentral American IndianCherokeeCheyenneChickasawChileanChineseChippewaChoctawColombianColvilleComancheCosta RicanCreeCreekCroatianCrowCubanCypriotCzechCzechoslovakianDanishDelawareDominicanDutchDutch West IndianEastern EuropeanEcuadorianEgyptianEnglishEstonianEthiopianEuropeanFijianFilipinoFinnishFrenchFrench American IndianFrench CanadianGermanGerman RussianGhanaianGreekGuamanian/ChamorroGuatemalanGuyaneseHaitianHmongHonduranHopiHoumaHungarianIcelanderIndian (Asian)IndonesianInupiatIranianIraqiIrishIroquoisIsraeliItalianJamaicanJapaneseJordanianKenyanKiowaKoreanLaotianLatvianLebaneseLiberianLithuanianLumbeeLuxembourgerMacedonianMalaysianMalteseMarshalleseMenomineeMexicanMexican American IndianMongolianMoroccanNative HawaiianNavajoNepaleseNew ZealanderNicaraguanNigerianNorthern EuropeanNorwegianOkinawanOsageOttawaPaiutePakistaniPalestinianPanamanianParaguayanPennsylvania GermanPeruvianPimaPolishPortuguesePotawatomiPuebloPuerto RicanPuget Sound SalishRomanianRussianSalvadoranScandinavianScotch-IrishScottishSeminoleSenegaleseSerbianShoshoneSierra LeoneanSiouxSlavicSlovakSloveneSomaliSouth AfricanSouth AmericanSouth American IndianSoviet UnionSpaniardSpanishSpanish AmericanSpanish American IndianSri LankanSubsaharan AfricanSudaneseSwedishSwissSyrianTaiwaneseThaiTlingit-HaidaTohono O'OdhamTonganTrinidadian and TobagonianTsimshianTurkishU.S. Virgin IslanderUgandanUkrainianUruguayanUteVenezuelanVietnameseWelshWest IndianYakamaYaquiYugoslavianYumanYup'ikZimbabwean
Immigration
NonimmigrantsImmigrantsAfghanistanAfricaAlbaniaArgentinaArmeniaAsiaAustraliaAustriaBahamasBangladeshBarbadosBelarusBelgiumBelizeBoliviaBosnia and HerzegovinaBrazilBulgariaBurma/MyanmarCabo VerdeCambodiaCameroonCanadaCaribbeanCentral AmericaChileChinaColombiaCongoCosta RicaCroatiaCubaCzechoslovakiaDenmarkDominicaDominican RepublicEastern AfricaEastern AsiaEastern EuropeEcuadorEgyptEl SalvadorEnglandEritreaEthiopiaEuropeFijiFranceGermanyGhanaGreeceGrenadaGuatemalaGuyanaHaitiHondurasHong KongHungaryIndiaIndonesiaIranIraqIrelandIsraelItalyJamaicaJapanJordanKazakhstanKenyaKoreaKuwaitLaosLatin AmericaLatviaLebanonLiberiaLithuaniaMalaysiaMexicoMicronesiaMiddle AfricaMoldovaMoroccoNepalNetherlandsNicaraguaNigeriaNorth AmericaNorth MacedoniaNorthern AfricaNorthern EuropeNorwayOceaniaPakistanPanamaPeruPhilippinesPolandPortugalRomaniaRussiaSaudi ArabiaScotlandSenegalSerbiaSierra LeoneSingaporeSomaliaSouth AfricaSouth AmericaSouth Central AsiaSouth Eastern AsiaSouthern EuropeSpainSri LankaSt. Vincent and the GrenadinesSudanSwedenSwitzerlandSyriaTaiwanThailandTrinidad and TobagoTurkeyUgandaUkraineUruguayUzbekistanVenezuelaVietnamWest IndiesWestern AfricaWestern AsiaWestern EuropeYemenZaireZimbabweAzores
Samoan
Race
Ancestry
AfghanAfricanAlaska NativeAlaskan AthabascanAlbanianAleutAlsatianAmericanApacheArabArapahoArgentineanArmenianAssyrian/Chaldean/SyriacAustralianAustrianBahamianBangladeshiBarbadianBasqueBelgianBelizeanBermudanBhutaneseBlackfeetBolivianBrazilianBritishBritish West IndianBulgarianBurmeseCajunCambodianCanadianCape VerdeanCarpatho RusynCelticCentral AmericanCentral American IndianCherokeeChickasawChileanChineseChippewaChoctawColombianColvilleComancheCosta RicanCreeCreekCroatianCrowCubanCypriotCzechCzechoslovakianDanishDelawareDominicanDutchDutch West IndianEastern EuropeanEcuadorianEgyptianEnglishEstonianEthiopianEuropeanFijianFilipinoFinnishFrenchFrench American IndianFrench CanadianGermanGerman RussianGhanaianGreekGuamanian/ChamorroGuatemalanGuyaneseHaitianHmongHonduranHopiHoumaHungarianIcelanderIndian (Asian)IndonesianInupiatIranianIraqiIrishIroquoisIsraeliItalianJamaicanJapaneseJordanianKenyanKiowaKoreanLaotianLatvianLebaneseLiberianLithuanianLumbeeLuxembourgerMacedonianMalaysianMalteseMarshalleseMenomineeMexicanMexican American IndianMongolianMoroccanNative HawaiianNavajoNepaleseNew ZealanderNicaraguanNigerianNorthern EuropeanNorwegianOkinawanOsageOttawaPaiutePakistaniPalestinianPanamanianParaguayanPennsylvania GermanPeruvianPimaPolishPortuguesePotawatomiPuebloPuerto RicanPuget Sound SalishRomanianRussianSalvadoranSamoanScandinavianScotch-IrishScottishSeminoleSenegaleseSerbianShoshoneSierra LeoneanSiouxSlavicSlovakSloveneSomaliSouth AfricanSouth AmericanSouth American IndianSoviet UnionSpaniardSpanishSpanish AmericanSpanish American IndianSri LankanSubsaharan AfricanSudaneseSwedishSwissSyrianTaiwaneseThaiTlingit-HaidaTohono O'OdhamTonganTrinidadian and TobagonianTsimshianTurkishU.S. Virgin IslanderUgandanUkrainianUruguayanUteVenezuelanVietnameseWelshWest IndianYakamaYaquiYugoslavianYumanYup'ikZimbabwean
Immigration
NonimmigrantsImmigrantsAfghanistanAfricaAlbaniaArgentinaArmeniaAsiaAustraliaAustriaBahamasBangladeshBarbadosBelarusBelgiumBelizeBoliviaBosnia and HerzegovinaBrazilBulgariaBurma/MyanmarCabo VerdeCambodiaCameroonCanadaCaribbeanCentral AmericaChileChinaColombiaCongoCosta RicaCroatiaCubaCzechoslovakiaDenmarkDominicaDominican RepublicEastern AfricaEastern AsiaEastern EuropeEcuadorEgyptEl SalvadorEnglandEritreaEthiopiaEuropeFijiFranceGermanyGhanaGreeceGrenadaGuatemalaGuyanaHaitiHondurasHong KongHungaryIndiaIndonesiaIranIraqIrelandIsraelItalyJamaicaJapanJordanKazakhstanKenyaKoreaKuwaitLaosLatin AmericaLatviaLebanonLiberiaLithuaniaMalaysiaMexicoMicronesiaMiddle AfricaMoldovaMoroccoNepalNetherlandsNicaraguaNigeriaNorth AmericaNorth MacedoniaNorthern AfricaNorthern EuropeNorwayOceaniaPakistanPanamaPeruPhilippinesPolandPortugalRomaniaRussiaSaudi ArabiaScotlandSenegalSerbiaSierra LeoneSingaporeSomaliaSouth AfricaSouth AmericaSouth Central AsiaSouth Eastern AsiaSouthern EuropeSpainSri LankaSt. Vincent and the GrenadinesSudanSwedenSwitzerlandSyriaTaiwanThailandTrinidad and TobagoTurkeyUgandaUkraineUruguayUzbekistanVenezuelaVietnamWest IndiesWestern AfricaWestern AsiaWestern EuropeYemenZaireZimbabweAzores
Child Poverty Among Girls Under 16
Income
Poverty
Unemployment
Labor Participation
Family Structure
Vehicle Availability
Education Level
Disability

Child Poverty Among Girls Under 16 Comparison

Cheyenne

Samoans

Tragic
Excellent
26.3%
CHILD POVERTY AMONG GIRLS UNDER 16
0.0/ 100
METRIC RATING
338th/ 347
METRIC RANK
15.7%
CHILD POVERTY AMONG GIRLS UNDER 16
84.2/ 100
METRIC RATING
146th/ 347
METRIC RANK

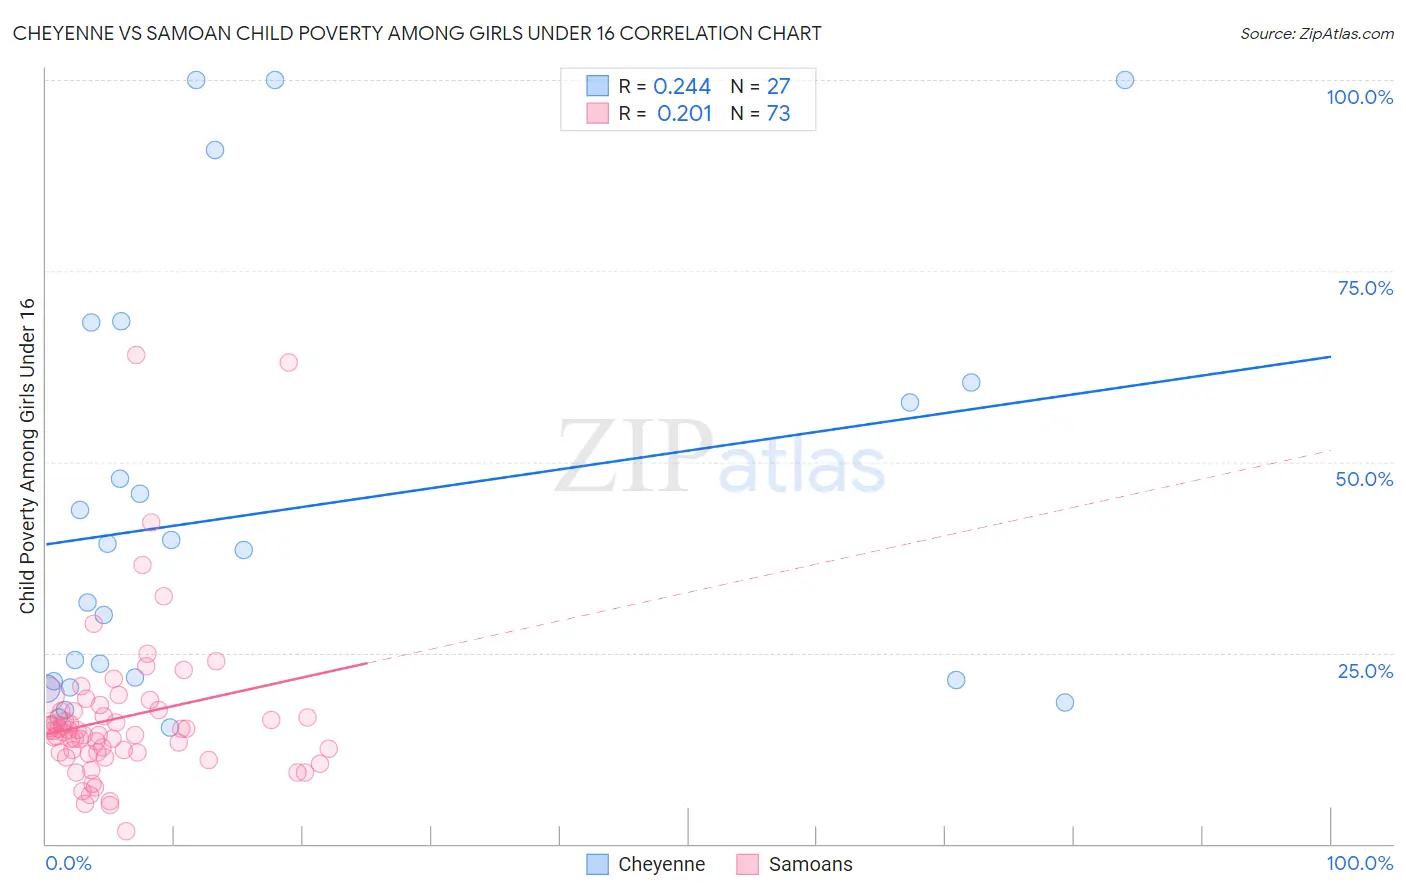
Cheyenne vs Samoan Child Poverty Among Girls Under 16 Correlation Chart

The statistical analysis conducted on geographies consisting of 80,342,731 people shows a weak positive correlation between the proportion of Cheyenne and poverty level among girls under the age of 16 in the United States with a correlation coefficient (R) of 0.244 and weighted average of 26.3%. Similarly, the statistical analysis conducted on geographies consisting of 223,807,400 people shows a weak positive correlation between the proportion of Samoans and poverty level among girls under the age of 16 in the United States with a correlation coefficient (R) of 0.201 and weighted average of 15.7%, a difference of 67.6%.
Cheyenne vs Samoan Child Poverty Among Girls Under 16

Child Poverty Among Girls Under 16 Correlation Summary

MeasurementCheyenneSamoan
Minimum15.2%1.7%
Maximum100.0%64.0%
Range84.8%62.3%
Mean43.8%16.5%
Median38.5%14.8%
Interquartile 25% (IQ1)21.3%11.9%
Interquartile 75% (IQ3)60.4%17.5%
Interquartile Range (IQR)39.1%5.5%
Standard Deviation (Sample)27.8%10.3%
Standard Deviation (Population)27.3%10.3%

Similar Demographics by Child Poverty Among Girls Under 16

Demographics Similar to Cheyenne by Child Poverty Among Girls Under 16

In terms of child poverty among girls under 16, the demographic groups most similar to Cheyenne are Crow (26.4%, a difference of 0.34%), Yup'ik (25.8%, a difference of 1.8%), Sioux (25.6%, a difference of 2.7%), Yuman (27.1%, a difference of 3.1%), and Pueblo (25.2%, a difference of 4.3%).
DemographicsRating | RankChild Poverty Among Girls Under 16
Apache
0.0
/100
|
#331
Tragic
23.8%
Natives/Alaskans
0.0
/100
|
#332
Tragic
24.0%
Blacks/African Americans
0.0
/100
|
#333
Tragic
24.7%
Menominee
0.0
/100
|
#334
Tragic
25.0%
Pueblo
0.0
/100
|
#335
Tragic
25.2%
Sioux
0.0
/100
|
#336
Tragic
25.6%
Yup'ik
0.0
/100
|
#337
Tragic
25.8%
Cheyenne
0.0
/100
|
#338
Tragic
26.3%
Crow
0.0
/100
|
#339
Tragic
26.4%
Yuman
0.0
/100
|
#340
Tragic
27.1%
Hopi
0.0
/100
|
#341
Tragic
27.9%
Pima
0.0
/100
|
#342
Tragic
28.2%
Immigrants | Yemen
0.0
/100
|
#343
Tragic
29.5%
Navajo
0.0
/100
|
#344
Tragic
30.5%
Lumbee
0.0
/100
|
#345
Tragic
30.7%

Demographics Similar to Samoans by Child Poverty Among Girls Under 16

In terms of child poverty among girls under 16, the demographic groups most similar to Samoans are Slavic (15.7%, a difference of 0.23%), Welsh (15.6%, a difference of 0.29%), Icelander (15.7%, a difference of 0.38%), Israeli (15.6%, a difference of 0.50%), and Immigrants from Peru (15.6%, a difference of 0.59%).
DemographicsRating | RankChild Poverty Among Girls Under 16
Armenians
87.9
/100
|
#139
Excellent
15.5%
New Zealanders
87.2
/100
|
#140
Excellent
15.6%
Immigrants | Jordan
87.2
/100
|
#141
Excellent
15.6%
Canadians
87.1
/100
|
#142
Excellent
15.6%
Immigrants | Peru
86.6
/100
|
#143
Excellent
15.6%
Israelis
86.3
/100
|
#144
Excellent
15.6%
Welsh
85.4
/100
|
#145
Excellent
15.6%
Samoans
84.2
/100
|
#146
Excellent
15.7%
Slavs
83.1
/100
|
#147
Excellent
15.7%
Icelanders
82.4
/100
|
#148
Excellent
15.7%
Immigrants | Hungary
80.9
/100
|
#149
Excellent
15.8%
Immigrants | Albania
80.7
/100
|
#150
Excellent
15.8%
Venezuelans
80.1
/100
|
#151
Excellent
15.8%
Immigrants | Kuwait
79.4
/100
|
#152
Good
15.8%
Immigrants | Nepal
78.5
/100
|
#153
Good
15.9%