Subsaharan African vs Cheyenne Child Poverty Among Girls Under 16
COMPARE
Subsaharan African
Cheyenne
Child Poverty Among Girls Under 16
Child Poverty Among Girls Under 16 Comparison
Sub-Saharan Africans
Cheyenne
20.1%
CHILD POVERTY AMONG GIRLS UNDER 16
0.0/ 100
METRIC RATING
275th/ 347
METRIC RANK
26.3%
CHILD POVERTY AMONG GIRLS UNDER 16
0.0/ 100
METRIC RATING
338th/ 347
METRIC RANK
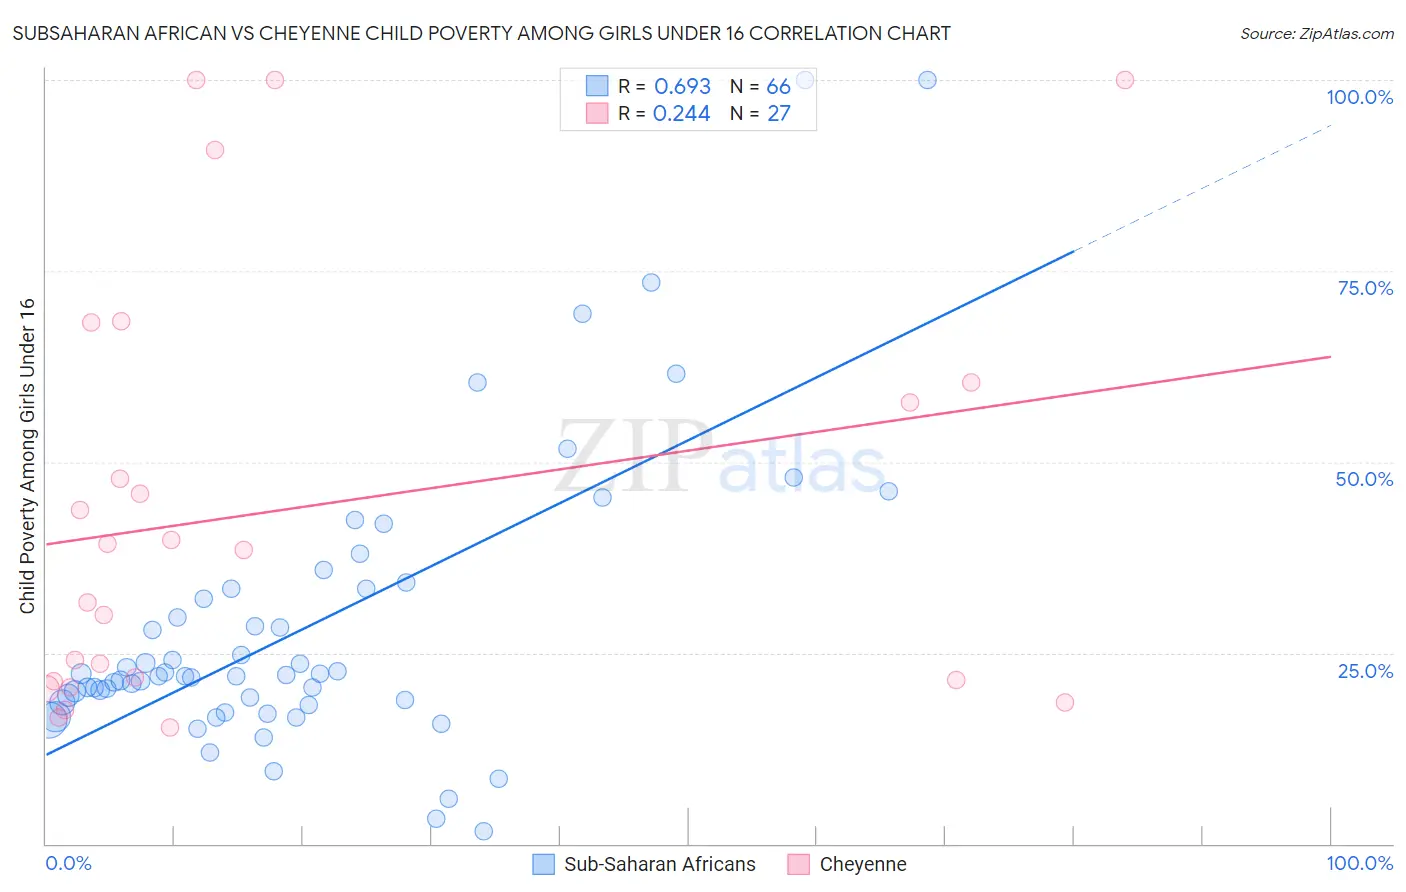
Subsaharan African vs Cheyenne Child Poverty Among Girls Under 16 Correlation Chart
The statistical analysis conducted on geographies consisting of 496,899,151 people shows a significant positive correlation between the proportion of Sub-Saharan Africans and poverty level among girls under the age of 16 in the United States with a correlation coefficient (R) of 0.693 and weighted average of 20.1%. Similarly, the statistical analysis conducted on geographies consisting of 80,342,731 people shows a weak positive correlation between the proportion of Cheyenne and poverty level among girls under the age of 16 in the United States with a correlation coefficient (R) of 0.244 and weighted average of 26.3%, a difference of 30.6%.
Child Poverty Among Girls Under 16 Correlation Summary
| Measurement | Subsaharan African | Cheyenne |
| Minimum | 1.7% | 15.2% |
| Maximum | 100.0% | 100.0% |
| Range | 98.3% | 84.8% |
| Mean | 28.3% | 43.8% |
| Median | 21.9% | 38.5% |
| Interquartile 25% (IQ1) | 18.5% | 21.3% |
| Interquartile 75% (IQ3) | 33.3% | 60.4% |
| Interquartile Range (IQR) | 14.8% | 39.1% |
| Standard Deviation (Sample) | 19.2% | 27.8% |
| Standard Deviation (Population) | 19.1% | 27.3% |
Similar Demographics by Child Poverty Among Girls Under 16
Demographics Similar to Sub-Saharan Africans by Child Poverty Among Girls Under 16
In terms of child poverty among girls under 16, the demographic groups most similar to Sub-Saharan Africans are Immigrants from St. Vincent and the Grenadines (20.1%, a difference of 0.14%), Comanche (20.2%, a difference of 0.32%), Belizean (20.2%, a difference of 0.43%), Barbadian (20.2%, a difference of 0.46%), and Bangladeshi (20.0%, a difference of 0.57%).
| Demographics | Rating | Rank | Child Poverty Among Girls Under 16 |
| Spanish American Indians | 0.1 /100 | #268 | Tragic 19.9% |
| Liberians | 0.1 /100 | #269 | Tragic 19.9% |
| Cherokee | 0.1 /100 | #270 | Tragic 19.9% |
| Immigrants | Barbados | 0.1 /100 | #271 | Tragic 19.9% |
| Immigrants | El Salvador | 0.1 /100 | #272 | Tragic 20.0% |
| Bangladeshis | 0.1 /100 | #273 | Tragic 20.0% |
| Immigrants | St. Vincent and the Grenadines | 0.0 /100 | #274 | Tragic 20.1% |
| Sub-Saharan Africans | 0.0 /100 | #275 | Tragic 20.1% |
| Comanche | 0.0 /100 | #276 | Tragic 20.2% |
| Belizeans | 0.0 /100 | #277 | Tragic 20.2% |
| Barbadians | 0.0 /100 | #278 | Tragic 20.2% |
| Immigrants | Zaire | 0.0 /100 | #279 | Tragic 20.2% |
| Immigrants | Liberia | 0.0 /100 | #280 | Tragic 20.2% |
| Central Americans | 0.0 /100 | #281 | Tragic 20.2% |
| West Indians | 0.0 /100 | #282 | Tragic 20.3% |
Demographics Similar to Cheyenne by Child Poverty Among Girls Under 16
In terms of child poverty among girls under 16, the demographic groups most similar to Cheyenne are Crow (26.4%, a difference of 0.34%), Yup'ik (25.8%, a difference of 1.8%), Sioux (25.6%, a difference of 2.7%), Yuman (27.1%, a difference of 3.1%), and Pueblo (25.2%, a difference of 4.3%).
| Demographics | Rating | Rank | Child Poverty Among Girls Under 16 |
| Apache | 0.0 /100 | #331 | Tragic 23.8% |
| Natives/Alaskans | 0.0 /100 | #332 | Tragic 24.0% |
| Blacks/African Americans | 0.0 /100 | #333 | Tragic 24.7% |
| Menominee | 0.0 /100 | #334 | Tragic 25.0% |
| Pueblo | 0.0 /100 | #335 | Tragic 25.2% |
| Sioux | 0.0 /100 | #336 | Tragic 25.6% |
| Yup'ik | 0.0 /100 | #337 | Tragic 25.8% |
| Cheyenne | 0.0 /100 | #338 | Tragic 26.3% |
| Crow | 0.0 /100 | #339 | Tragic 26.4% |
| Yuman | 0.0 /100 | #340 | Tragic 27.1% |
| Hopi | 0.0 /100 | #341 | Tragic 27.9% |
| Pima | 0.0 /100 | #342 | Tragic 28.2% |
| Immigrants | Yemen | 0.0 /100 | #343 | Tragic 29.5% |
| Navajo | 0.0 /100 | #344 | Tragic 30.5% |
| Lumbee | 0.0 /100 | #345 | Tragic 30.7% |