French Canadian vs Samoan Child Poverty Among Girls Under 16
COMPARE
French Canadian
Samoan
Child Poverty Among Girls Under 16
Child Poverty Among Girls Under 16 Comparison
French Canadians
Samoans
16.1%
CHILD POVERTY AMONG GIRLS UNDER 16
68.7/ 100
METRIC RATING
162nd/ 347
METRIC RANK
15.7%
CHILD POVERTY AMONG GIRLS UNDER 16
84.2/ 100
METRIC RATING
146th/ 347
METRIC RANK
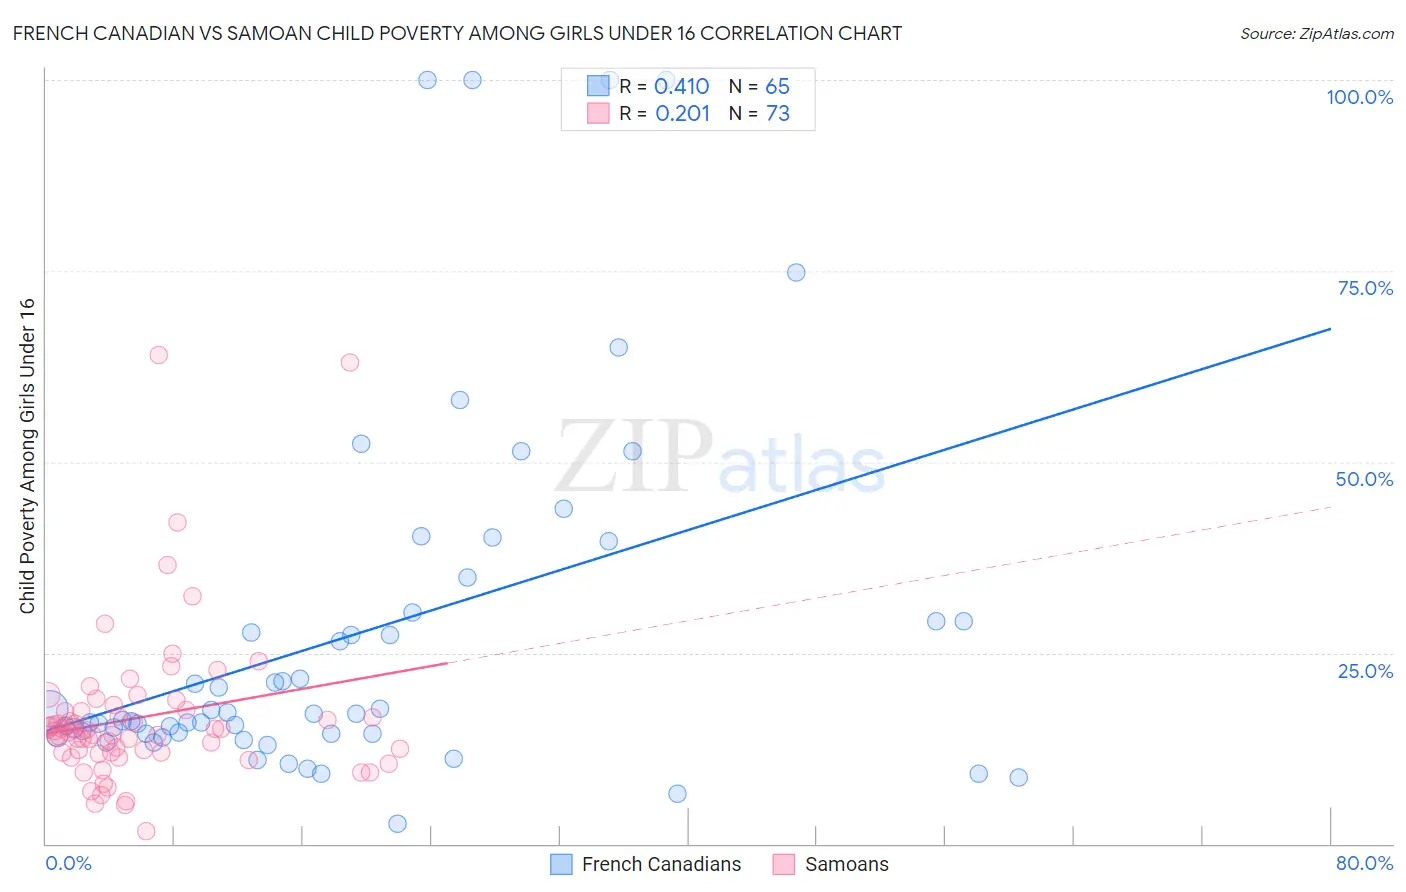
French Canadian vs Samoan Child Poverty Among Girls Under 16 Correlation Chart
The statistical analysis conducted on geographies consisting of 487,191,826 people shows a moderate positive correlation between the proportion of French Canadians and poverty level among girls under the age of 16 in the United States with a correlation coefficient (R) of 0.410 and weighted average of 16.1%. Similarly, the statistical analysis conducted on geographies consisting of 223,807,400 people shows a weak positive correlation between the proportion of Samoans and poverty level among girls under the age of 16 in the United States with a correlation coefficient (R) of 0.201 and weighted average of 15.7%, a difference of 2.7%.
Child Poverty Among Girls Under 16 Correlation Summary
| Measurement | French Canadian | Samoan |
| Minimum | 2.6% | 1.7% |
| Maximum | 100.0% | 64.0% |
| Range | 97.4% | 62.3% |
| Mean | 27.4% | 16.5% |
| Median | 17.1% | 14.8% |
| Interquartile 25% (IQ1) | 14.4% | 11.9% |
| Interquartile 75% (IQ3) | 29.7% | 17.5% |
| Interquartile Range (IQR) | 15.3% | 5.5% |
| Standard Deviation (Sample) | 23.7% | 10.3% |
| Standard Deviation (Population) | 23.5% | 10.3% |
Demographics Similar to French Canadians and Samoans by Child Poverty Among Girls Under 16
In terms of child poverty among girls under 16, the demographic groups most similar to French Canadians are Immigrants from Oceania (16.1%, a difference of 0.050%), Immigrants from Colombia (16.1%, a difference of 0.11%), Immigrants from Northern Africa (16.0%, a difference of 0.47%), French (16.0%, a difference of 0.58%), and Slovak (15.9%, a difference of 0.97%). Similarly, the demographic groups most similar to Samoans are Slavic (15.7%, a difference of 0.23%), Welsh (15.6%, a difference of 0.29%), Icelander (15.7%, a difference of 0.38%), Israeli (15.6%, a difference of 0.50%), and Immigrants from Hungary (15.8%, a difference of 0.70%).
| Demographics | Rating | Rank | Child Poverty Among Girls Under 16 |
| Israelis | 86.3 /100 | #144 | Excellent 15.6% |
| Welsh | 85.4 /100 | #145 | Excellent 15.6% |
| Samoans | 84.2 /100 | #146 | Excellent 15.7% |
| Slavs | 83.1 /100 | #147 | Excellent 15.7% |
| Icelanders | 82.4 /100 | #148 | Excellent 15.7% |
| Immigrants | Hungary | 80.9 /100 | #149 | Excellent 15.8% |
| Immigrants | Albania | 80.7 /100 | #150 | Excellent 15.8% |
| Venezuelans | 80.1 /100 | #151 | Excellent 15.8% |
| Immigrants | Kuwait | 79.4 /100 | #152 | Good 15.8% |
| Immigrants | Nepal | 78.5 /100 | #153 | Good 15.9% |
| Immigrants | Chile | 76.7 /100 | #154 | Good 15.9% |
| Syrians | 76.7 /100 | #155 | Good 15.9% |
| Immigrants | Fiji | 76.1 /100 | #156 | Good 15.9% |
| Colombians | 76.1 /100 | #157 | Good 15.9% |
| Guamanians/Chamorros | 75.3 /100 | #158 | Good 15.9% |
| Slovaks | 75.2 /100 | #159 | Good 15.9% |
| French | 72.8 /100 | #160 | Good 16.0% |
| Immigrants | Northern Africa | 72.0 /100 | #161 | Good 16.0% |
| French Canadians | 68.7 /100 | #162 | Good 16.1% |
| Immigrants | Oceania | 68.4 /100 | #163 | Good 16.1% |
| Immigrants | Colombia | 67.8 /100 | #164 | Good 16.1% |