Slavic vs Spanish American Married-Couple Family Poverty
COMPARE
Slavic
Spanish American
Married-Couple Family Poverty
Married-Couple Family Poverty Comparison
Slavs
Spanish Americans
4.4%
MARRIED-COUPLE FAMILY POVERTY
99.4/ 100
METRIC RATING
68th/ 347
METRIC RANK
6.2%
MARRIED-COUPLE FAMILY POVERTY
0.2/ 100
METRIC RATING
267th/ 347
METRIC RANK
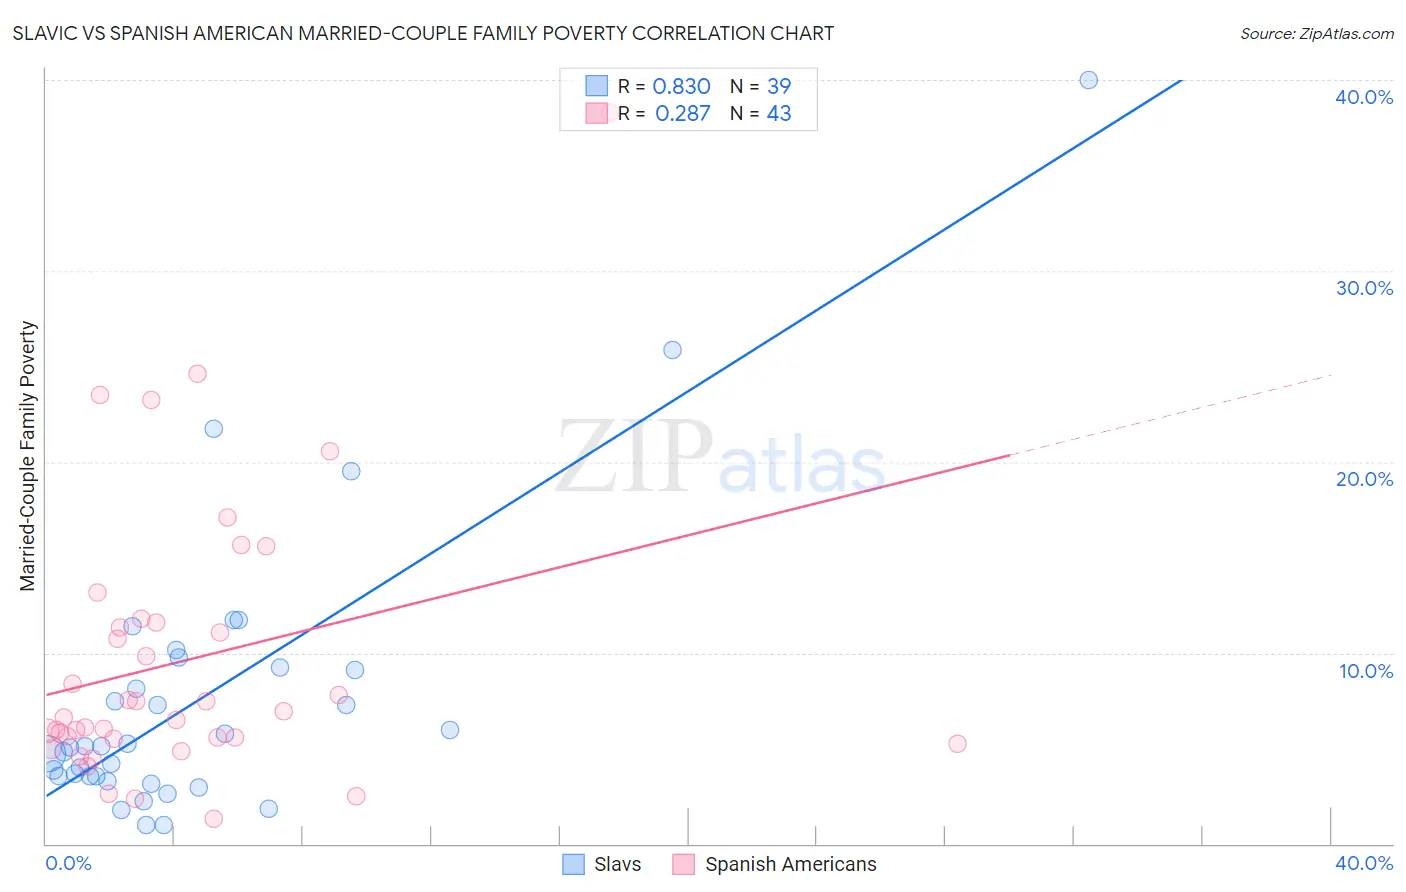
Slavic vs Spanish American Married-Couple Family Poverty Correlation Chart
The statistical analysis conducted on geographies consisting of 268,876,285 people shows a very strong positive correlation between the proportion of Slavs and poverty level among married-couple families in the United States with a correlation coefficient (R) of 0.830 and weighted average of 4.4%. Similarly, the statistical analysis conducted on geographies consisting of 103,037,673 people shows a weak positive correlation between the proportion of Spanish Americans and poverty level among married-couple families in the United States with a correlation coefficient (R) of 0.287 and weighted average of 6.2%, a difference of 38.9%.
Married-Couple Family Poverty Correlation Summary
| Measurement | Slavic | Spanish American |
| Minimum | 0.99% | 1.3% |
| Maximum | 40.0% | 38.3% |
| Range | 39.0% | 37.0% |
| Mean | 7.6% | 9.6% |
| Median | 5.1% | 6.6% |
| Interquartile 25% (IQ1) | 3.5% | 5.5% |
| Interquartile 75% (IQ3) | 9.3% | 11.6% |
| Interquartile Range (IQR) | 5.8% | 6.0% |
| Standard Deviation (Sample) | 7.6% | 7.3% |
| Standard Deviation (Population) | 7.5% | 7.3% |
Similar Demographics by Married-Couple Family Poverty
Demographics Similar to Slavs by Married-Couple Family Poverty
In terms of married-couple family poverty, the demographic groups most similar to Slavs are Immigrants from Canada (4.4%, a difference of 0.010%), New Zealander (4.4%, a difference of 0.010%), Immigrants from Serbia (4.4%, a difference of 0.060%), Immigrants from Korea (4.5%, a difference of 0.14%), and Macedonian (4.4%, a difference of 0.19%).
| Demographics | Rating | Rank | Married-Couple Family Poverty |
| Okinawans | 99.6 /100 | #61 | Exceptional 4.4% |
| Immigrants | Australia | 99.6 /100 | #62 | Exceptional 4.4% |
| Immigrants | Sri Lanka | 99.6 /100 | #63 | Exceptional 4.4% |
| Immigrants | Bulgaria | 99.5 /100 | #64 | Exceptional 4.4% |
| Macedonians | 99.4 /100 | #65 | Exceptional 4.4% |
| Immigrants | Serbia | 99.4 /100 | #66 | Exceptional 4.4% |
| Immigrants | Canada | 99.4 /100 | #67 | Exceptional 4.4% |
| Slavs | 99.4 /100 | #68 | Exceptional 4.4% |
| New Zealanders | 99.4 /100 | #69 | Exceptional 4.4% |
| Immigrants | Korea | 99.4 /100 | #70 | Exceptional 4.5% |
| Immigrants | North America | 99.3 /100 | #71 | Exceptional 4.5% |
| Immigrants | England | 99.3 /100 | #72 | Exceptional 4.5% |
| Ukrainians | 99.2 /100 | #73 | Exceptional 4.5% |
| Immigrants | Austria | 99.2 /100 | #74 | Exceptional 4.5% |
| Cambodians | 99.2 /100 | #75 | Exceptional 4.5% |
Demographics Similar to Spanish Americans by Married-Couple Family Poverty
In terms of married-couple family poverty, the demographic groups most similar to Spanish Americans are Creek (6.2%, a difference of 0.050%), Blackfeet (6.2%, a difference of 0.13%), Alaska Native (6.2%, a difference of 0.48%), Immigrants from Congo (6.1%, a difference of 0.56%), and Immigrants from West Indies (6.2%, a difference of 0.65%).
| Demographics | Rating | Rank | Married-Couple Family Poverty |
| Jamaicans | 0.3 /100 | #260 | Tragic 6.1% |
| Senegalese | 0.3 /100 | #261 | Tragic 6.1% |
| Shoshone | 0.3 /100 | #262 | Tragic 6.1% |
| Immigrants | Senegal | 0.3 /100 | #263 | Tragic 6.1% |
| Immigrants | Congo | 0.2 /100 | #264 | Tragic 6.1% |
| Blackfeet | 0.2 /100 | #265 | Tragic 6.2% |
| Creek | 0.2 /100 | #266 | Tragic 6.2% |
| Spanish Americans | 0.2 /100 | #267 | Tragic 6.2% |
| Alaska Natives | 0.2 /100 | #268 | Tragic 6.2% |
| Immigrants | West Indies | 0.1 /100 | #269 | Tragic 6.2% |
| Immigrants | Jamaica | 0.1 /100 | #270 | Tragic 6.2% |
| Immigrants | Bahamas | 0.1 /100 | #271 | Tragic 6.2% |
| Trinidadians and Tobagonians | 0.1 /100 | #272 | Tragic 6.2% |
| Colville | 0.1 /100 | #273 | Tragic 6.3% |
| Barbadians | 0.1 /100 | #274 | Tragic 6.3% |