Inupiat vs Spanish American Married-Couple Family Poverty
COMPARE
Inupiat
Spanish American
Married-Couple Family Poverty
Married-Couple Family Poverty Comparison
Inupiat
Spanish Americans
7.1%
MARRIED-COUPLE FAMILY POVERTY
0.0/ 100
METRIC RATING
315th/ 347
METRIC RANK
6.2%
MARRIED-COUPLE FAMILY POVERTY
0.2/ 100
METRIC RATING
267th/ 347
METRIC RANK
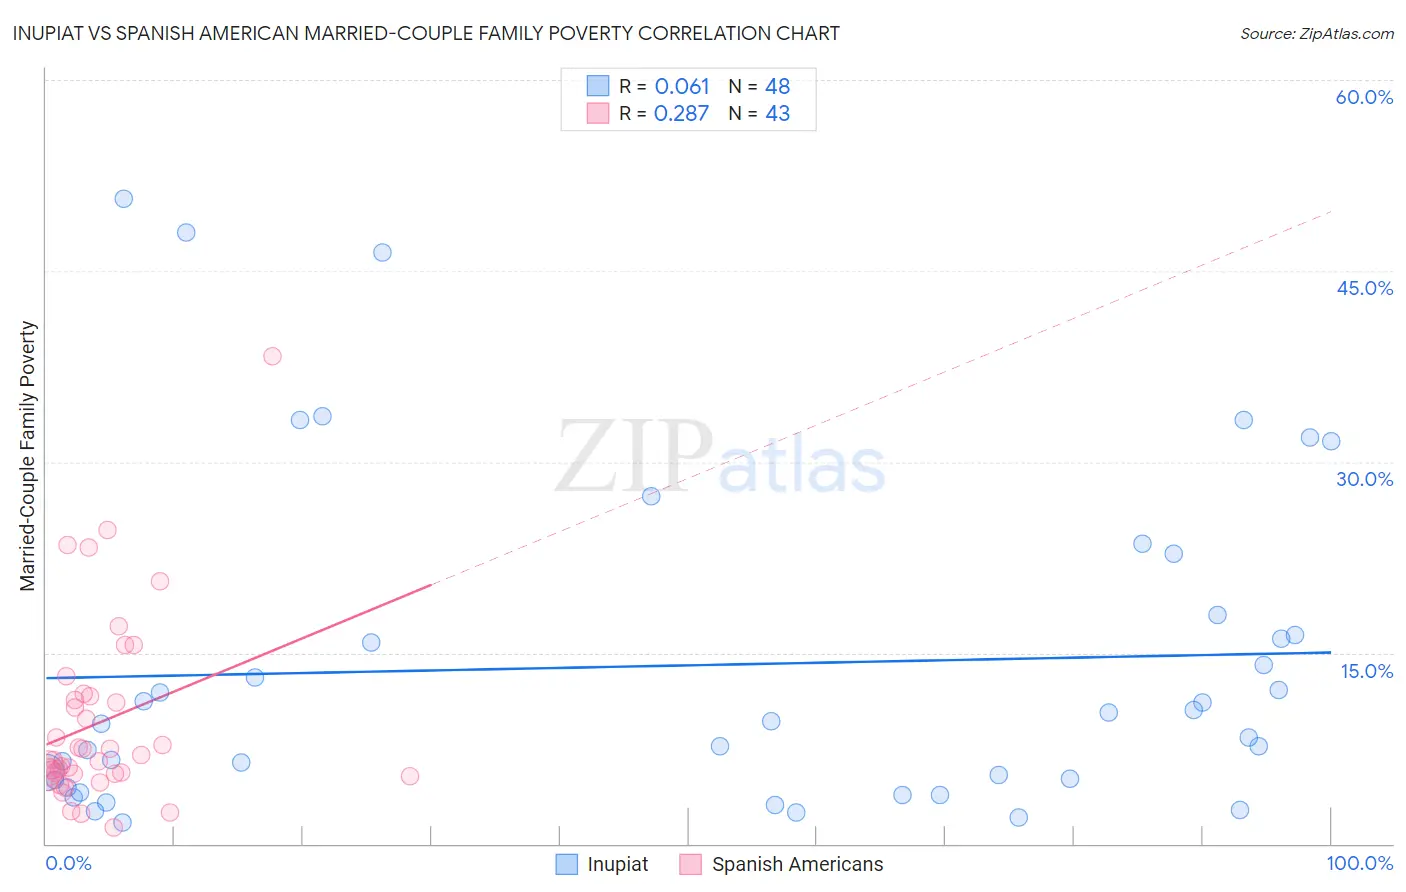
Inupiat vs Spanish American Married-Couple Family Poverty Correlation Chart
The statistical analysis conducted on geographies consisting of 96,004,773 people shows a slight positive correlation between the proportion of Inupiat and poverty level among married-couple families in the United States with a correlation coefficient (R) of 0.061 and weighted average of 7.1%. Similarly, the statistical analysis conducted on geographies consisting of 103,037,673 people shows a weak positive correlation between the proportion of Spanish Americans and poverty level among married-couple families in the United States with a correlation coefficient (R) of 0.287 and weighted average of 6.2%, a difference of 15.7%.
Married-Couple Family Poverty Correlation Summary
| Measurement | Inupiat | Spanish American |
| Minimum | 1.6% | 1.3% |
| Maximum | 50.7% | 38.3% |
| Range | 49.0% | 37.0% |
| Mean | 14.0% | 9.6% |
| Median | 9.6% | 6.6% |
| Interquartile 25% (IQ1) | 4.7% | 5.5% |
| Interquartile 75% (IQ3) | 17.2% | 11.6% |
| Interquartile Range (IQR) | 12.5% | 6.0% |
| Standard Deviation (Sample) | 12.9% | 7.3% |
| Standard Deviation (Population) | 12.8% | 7.3% |
Similar Demographics by Married-Couple Family Poverty
Demographics Similar to Inupiat by Married-Couple Family Poverty
In terms of married-couple family poverty, the demographic groups most similar to Inupiat are Honduran (7.2%, a difference of 0.15%), British West Indian (7.1%, a difference of 0.24%), Mexican (7.2%, a difference of 0.47%), Immigrants from St. Vincent and the Grenadines (7.1%, a difference of 0.54%), and Immigrants from Guatemala (7.2%, a difference of 0.63%).
| Demographics | Rating | Rank | Married-Couple Family Poverty |
| Spanish American Indians | 0.0 /100 | #308 | Tragic 7.1% |
| Hopi | 0.0 /100 | #309 | Tragic 7.1% |
| Immigrants | Nicaragua | 0.0 /100 | #310 | Tragic 7.1% |
| Immigrants | Dominica | 0.0 /100 | #311 | Tragic 7.1% |
| Immigrants | Armenia | 0.0 /100 | #312 | Tragic 7.1% |
| Immigrants | St. Vincent and the Grenadines | 0.0 /100 | #313 | Tragic 7.1% |
| British West Indians | 0.0 /100 | #314 | Tragic 7.1% |
| Inupiat | 0.0 /100 | #315 | Tragic 7.1% |
| Hondurans | 0.0 /100 | #316 | Tragic 7.2% |
| Mexicans | 0.0 /100 | #317 | Tragic 7.2% |
| Immigrants | Guatemala | 0.0 /100 | #318 | Tragic 7.2% |
| Immigrants | Latin America | 0.0 /100 | #319 | Tragic 7.2% |
| Immigrants | Grenada | 0.0 /100 | #320 | Tragic 7.3% |
| Immigrants | Caribbean | 0.0 /100 | #321 | Tragic 7.3% |
| Immigrants | Honduras | 0.0 /100 | #322 | Tragic 7.3% |
Demographics Similar to Spanish Americans by Married-Couple Family Poverty
In terms of married-couple family poverty, the demographic groups most similar to Spanish Americans are Creek (6.2%, a difference of 0.050%), Blackfeet (6.2%, a difference of 0.13%), Alaska Native (6.2%, a difference of 0.48%), Immigrants from Congo (6.1%, a difference of 0.56%), and Immigrants from West Indies (6.2%, a difference of 0.65%).
| Demographics | Rating | Rank | Married-Couple Family Poverty |
| Jamaicans | 0.3 /100 | #260 | Tragic 6.1% |
| Senegalese | 0.3 /100 | #261 | Tragic 6.1% |
| Shoshone | 0.3 /100 | #262 | Tragic 6.1% |
| Immigrants | Senegal | 0.3 /100 | #263 | Tragic 6.1% |
| Immigrants | Congo | 0.2 /100 | #264 | Tragic 6.1% |
| Blackfeet | 0.2 /100 | #265 | Tragic 6.2% |
| Creek | 0.2 /100 | #266 | Tragic 6.2% |
| Spanish Americans | 0.2 /100 | #267 | Tragic 6.2% |
| Alaska Natives | 0.2 /100 | #268 | Tragic 6.2% |
| Immigrants | West Indies | 0.1 /100 | #269 | Tragic 6.2% |
| Immigrants | Jamaica | 0.1 /100 | #270 | Tragic 6.2% |
| Immigrants | Bahamas | 0.1 /100 | #271 | Tragic 6.2% |
| Trinidadians and Tobagonians | 0.1 /100 | #272 | Tragic 6.2% |
| Colville | 0.1 /100 | #273 | Tragic 6.3% |
| Barbadians | 0.1 /100 | #274 | Tragic 6.3% |