Slavic vs Immigrants from Czechoslovakia Married-Couple Family Poverty
COMPARE
Slavic
Immigrants from Czechoslovakia
Married-Couple Family Poverty
Married-Couple Family Poverty Comparison
Slavs
Immigrants from Czechoslovakia
4.4%
MARRIED-COUPLE FAMILY POVERTY
99.4/ 100
METRIC RATING
68th/ 347
METRIC RANK
4.6%
MARRIED-COUPLE FAMILY POVERTY
98.5/ 100
METRIC RATING
89th/ 347
METRIC RANK
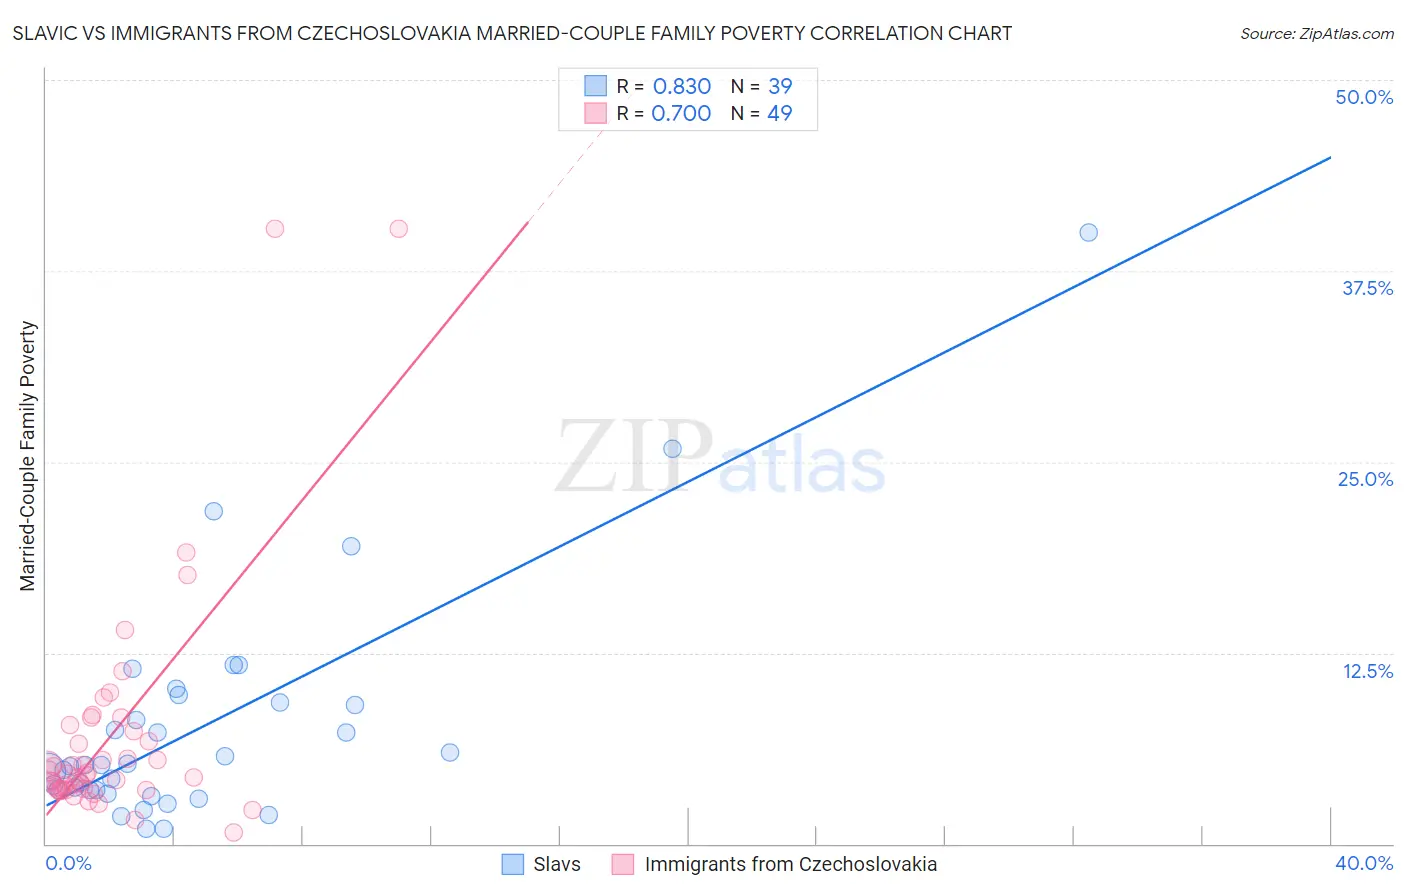
Slavic vs Immigrants from Czechoslovakia Married-Couple Family Poverty Correlation Chart
The statistical analysis conducted on geographies consisting of 268,876,285 people shows a very strong positive correlation between the proportion of Slavs and poverty level among married-couple families in the United States with a correlation coefficient (R) of 0.830 and weighted average of 4.4%. Similarly, the statistical analysis conducted on geographies consisting of 194,643,621 people shows a significant positive correlation between the proportion of Immigrants from Czechoslovakia and poverty level among married-couple families in the United States with a correlation coefficient (R) of 0.700 and weighted average of 4.6%, a difference of 3.1%.
Married-Couple Family Poverty Correlation Summary
| Measurement | Slavic | Immigrants from Czechoslovakia |
| Minimum | 0.99% | 0.74% |
| Maximum | 40.0% | 40.3% |
| Range | 39.0% | 39.5% |
| Mean | 7.6% | 7.1% |
| Median | 5.1% | 4.6% |
| Interquartile 25% (IQ1) | 3.5% | 3.6% |
| Interquartile 75% (IQ3) | 9.3% | 7.5% |
| Interquartile Range (IQR) | 5.8% | 4.0% |
| Standard Deviation (Sample) | 7.6% | 7.8% |
| Standard Deviation (Population) | 7.5% | 7.7% |
Similar Demographics by Married-Couple Family Poverty
Demographics Similar to Slavs by Married-Couple Family Poverty
In terms of married-couple family poverty, the demographic groups most similar to Slavs are Immigrants from Canada (4.4%, a difference of 0.010%), New Zealander (4.4%, a difference of 0.010%), Immigrants from Serbia (4.4%, a difference of 0.060%), Immigrants from Korea (4.5%, a difference of 0.14%), and Macedonian (4.4%, a difference of 0.19%).
| Demographics | Rating | Rank | Married-Couple Family Poverty |
| Okinawans | 99.6 /100 | #61 | Exceptional 4.4% |
| Immigrants | Australia | 99.6 /100 | #62 | Exceptional 4.4% |
| Immigrants | Sri Lanka | 99.6 /100 | #63 | Exceptional 4.4% |
| Immigrants | Bulgaria | 99.5 /100 | #64 | Exceptional 4.4% |
| Macedonians | 99.4 /100 | #65 | Exceptional 4.4% |
| Immigrants | Serbia | 99.4 /100 | #66 | Exceptional 4.4% |
| Immigrants | Canada | 99.4 /100 | #67 | Exceptional 4.4% |
| Slavs | 99.4 /100 | #68 | Exceptional 4.4% |
| New Zealanders | 99.4 /100 | #69 | Exceptional 4.4% |
| Immigrants | Korea | 99.4 /100 | #70 | Exceptional 4.5% |
| Immigrants | North America | 99.3 /100 | #71 | Exceptional 4.5% |
| Immigrants | England | 99.3 /100 | #72 | Exceptional 4.5% |
| Ukrainians | 99.2 /100 | #73 | Exceptional 4.5% |
| Immigrants | Austria | 99.2 /100 | #74 | Exceptional 4.5% |
| Cambodians | 99.2 /100 | #75 | Exceptional 4.5% |
Demographics Similar to Immigrants from Czechoslovakia by Married-Couple Family Poverty
In terms of married-couple family poverty, the demographic groups most similar to Immigrants from Czechoslovakia are Immigrants from Switzerland (4.6%, a difference of 0.070%), Bolivian (4.6%, a difference of 0.11%), Basque (4.6%, a difference of 0.11%), Immigrants from Norway (4.6%, a difference of 0.18%), and Immigrants from North Macedonia (4.6%, a difference of 0.21%).
| Demographics | Rating | Rank | Married-Couple Family Poverty |
| Canadians | 98.8 /100 | #82 | Exceptional 4.5% |
| Immigrants | Denmark | 98.8 /100 | #83 | Exceptional 4.6% |
| Immigrants | Croatia | 98.7 /100 | #84 | Exceptional 4.6% |
| South Africans | 98.7 /100 | #85 | Exceptional 4.6% |
| Immigrants | Turkey | 98.6 /100 | #86 | Exceptional 4.6% |
| Immigrants | North Macedonia | 98.6 /100 | #87 | Exceptional 4.6% |
| Bolivians | 98.6 /100 | #88 | Exceptional 4.6% |
| Immigrants | Czechoslovakia | 98.5 /100 | #89 | Exceptional 4.6% |
| Immigrants | Switzerland | 98.5 /100 | #90 | Exceptional 4.6% |
| Basques | 98.5 /100 | #91 | Exceptional 4.6% |
| Immigrants | Norway | 98.4 /100 | #92 | Exceptional 4.6% |
| Koreans | 98.3 /100 | #93 | Exceptional 4.6% |
| Immigrants | Italy | 98.3 /100 | #94 | Exceptional 4.6% |
| Portuguese | 98.3 /100 | #95 | Exceptional 4.6% |
| Immigrants | Poland | 98.3 /100 | #96 | Exceptional 4.6% |